

Question
Please calculate the following ratios for Moses Cone Memorial Hospital and Consolidated Affiliates for 2013 and 2014 and then compare the ratios to national industry
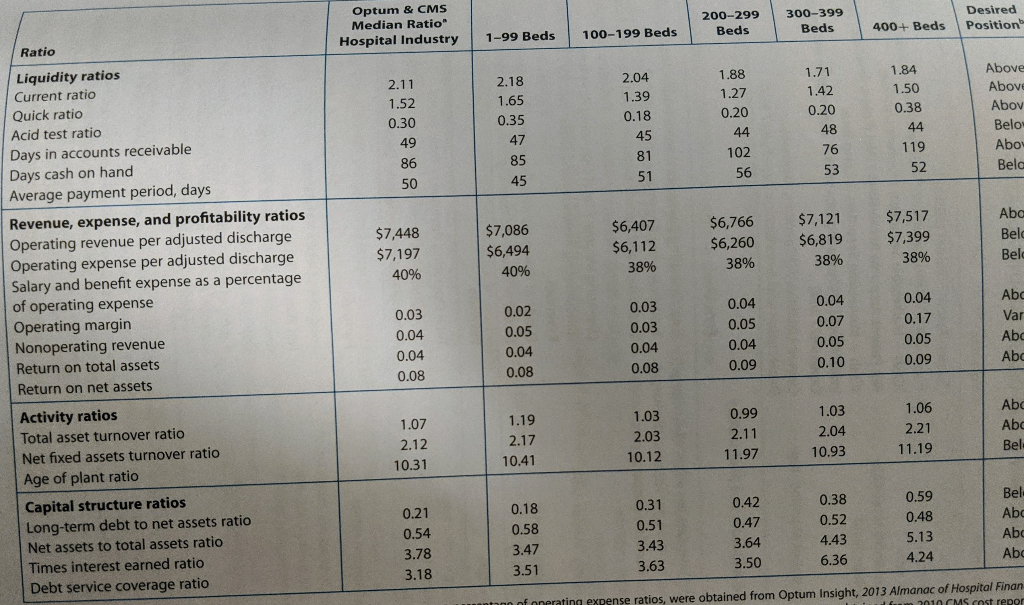
- Please calculate the following ratios for Moses Cone Memorial Hospital and Consolidated Affiliates for 2013 and 2014 and then compare the ratios to national industry benchmark using exhibit 4.16a on p. 185 in the textbook. (Moses Cone Memorial Hospital has more than 500 beds).
- Current ratio
- Days in accounts receivable
- Operating margin
- Return on total assets
- Salary expense as percentage of operating expense
- Interpret the above ratios: discuss briefly current liquidity and profitability positions and future outlooks based on these results.
- Given the following information, compute the working capital (working capital=current assets current liabilities).
Hint: sometimes not all the information given is necessary for calculations. The first step is to figure out which information is useful and which one is useless.
| Givens (in '000s): | |
| Inventory | $4,000 |
| Patient revenues (net of contractuals) | $302,000 |
| Gross plant, property, and equipment | $375,000 |
| Net accounts receivable | $85,000 |
| Ending balance, temporarily restricted net assets | $6,000 |
| Wages payable | $6,600 |
| Long-term debt | $218,400 |
| Supply expense | $34,000 |
| Net assets released from temporary restriction | $7,000 |
| Depreciation expense | $44,000 |
| General expense | $95,000 |
| Provision for bad debt expense | $4,500 |
| Cash and cash equivalents | $18,000 |
| Transfer to parent corporation | ($3,900) |
| Beginning balance, unrestricted net assets | $239,400 |
| Accounts payable | $11,000 |
| Beginning balance, temporarily restricted net assets | $13,000 |
| Interest expense | $6,000 |
| Labor expense | $123,000 |
| Accumulated depreciation | $22,000 |
| Long-term investments | $20,000 |
| Ending balance, unrestricted net assets | $238,000 |
Step by Step Solution
There are 3 Steps involved in it
Step: 1

Get Instant Access to Expert-Tailored Solutions
See step-by-step solutions with expert insights and AI powered tools for academic success
Step: 2

Step: 3
Ace Your Homework with AI
Get the answers you need in no time with our AI-driven, step-by-step assistance
Get Started
DOD Financial Management The Army Faces Significant Challenges In Achieving Audit Readiness For Its Military Pay
Authors: Government Accountability Office
1st Edition
1492310921, 978-1492310921