

Answered step by step
Verified Expert Solution
Question
1 Approved Answer
please choose drinking and driving in Canada to fo this project Objectives: . collect data for the past twenty years/months (at least 20 data points)
please choose drinking and driving in Canada to fo this project 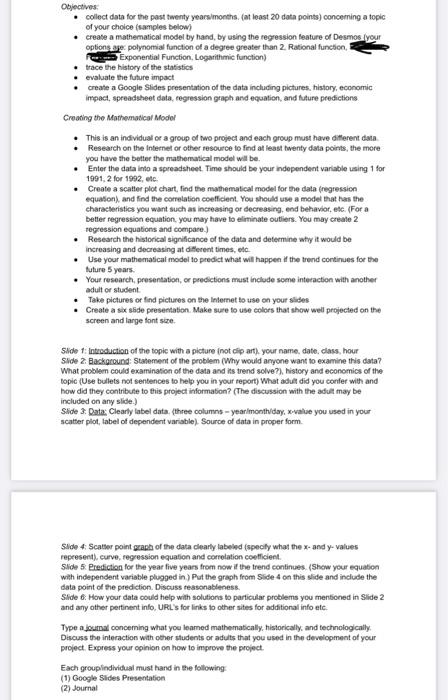
Objectives: . collect data for the past twenty years/months (at least 20 data points) concerning a topic of your choice (samples below) create a mathematical model by hand, by using the regression feature of Desmos lyour options are polynomial function of a degree greater than 2. Rational function Exponential Function, Logarithmic function) trace the history of the statistics evaluate the future impact create a Google Slides presentation of the data including pictures history, economic impact, spreadsheet data, regression graph and equation and future predictions Creating the Mathematical Model This is an individual or a group of two project and each group must have different data Research on the Internet or other resource to find at least twenty data points, the more you have the better the mathematical model will be Enter the data into a spreadsheet. Time should be your independent variable using 1 for 1991, 2 for 1992, etc. Create a scatter plot chart, find the mathematical model for the data (regression equation)and find the correlation coefficient. You should use a model that has the characteristics you want such as increasing or decreasing, end behavior, etc. (For a better regression equation, you may have to eliminate outiers. You may create 2 regression equations and compare.) Research the historical significance of the data and determine why it would be increasing and decreasing at different times, etc Use your mathematical model to predict what will happen if the trend continues for the future 5 years. Your research, presentation, ce predictions must include some interaction with another adult or student Take pictures or find pictures on the Internet to use on your sides Create a sx side presentation. Make sure to use colors that show well projected on the screen and large font size Side 1: Introduction of the topic with a picture inot clip art), your name, date.class, hour Slide 2 Background: Statement of the problem (Why would anyone want to examine this data? What problem could examination of the data and its trend solve?), history and economics of the topic Use bullets not sentences to help you in your report) What adult did you confer with and how did they contribute to this project information? (The discussion with the adult may be included on any slide) Slide 3: Data: Clearly label data. (three columns -year month day, x-value you used in your scatter plot, label of dependent variable). Source of data in proper form Slide 4 Scatter point graph of the data clearly labeled (specify what the x- and y-values represent), curve, regression equation and correlation coefficient Slide 5 Prediction for the year five years from now if the trend continues (Show your equation with independent variable plugged in) Put the graph from Side 4 on this slide and include the data point of the prediction Discuss reasonableness Slide 6. How your data could help with solutions to particular problems you mentioned in Slide 2 and any other pertinent info, URL's for links to other sites for additional info etc. Type Journal concerning what you leamed mathematically, historically, and technologically Discuss the interaction with other students or adults that you used in the development of your project Express your opinion on how to improve the project Each group individual must hand in the following (1) Google Slides Presentation (2) Journal Step by Step Solution
There are 3 Steps involved in it
Step: 1

Get Instant Access to Expert-Tailored Solutions
See step-by-step solutions with expert insights and AI powered tools for academic success
Step: 2

Step: 3
Ace Your Homework with AI
Get the answers you need in no time with our AI-driven, step-by-step assistance
Get Started
Intelligent Databases Technologies And Applications
Authors: Zongmin Ma
1st Edition
1599041219, 978-1599041216