Please describe the impact of the change in the dividend policy from the point of view of signaling and agency problem. Make any assumptions you need to make to support your comment.
Please work all your calculations in the below pictures , and answer the questions above both quantitatively and qualitatively 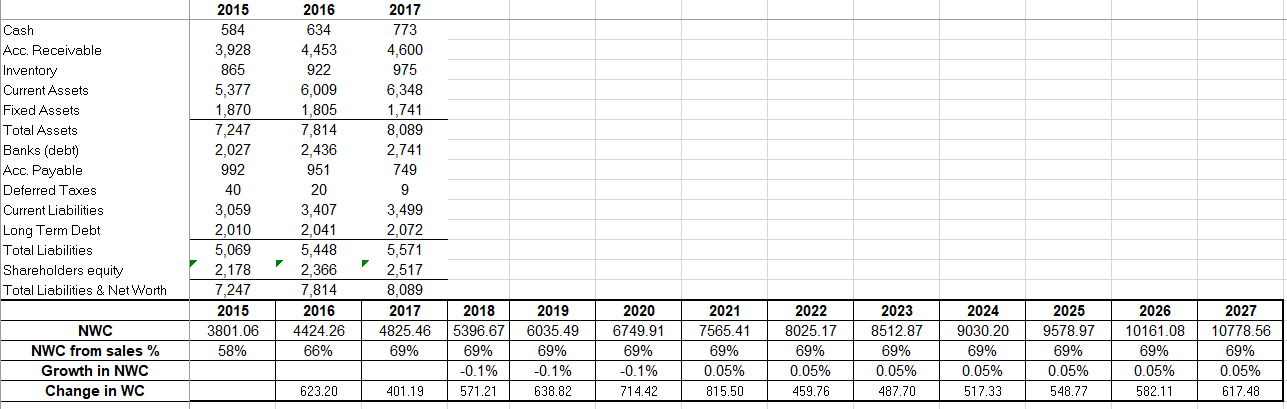
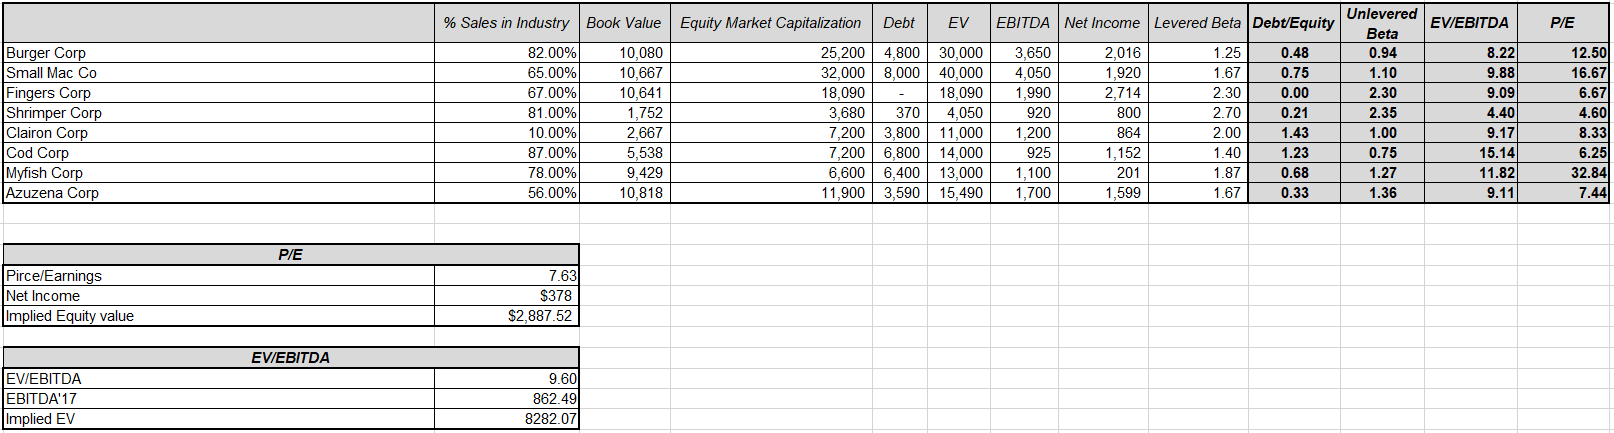
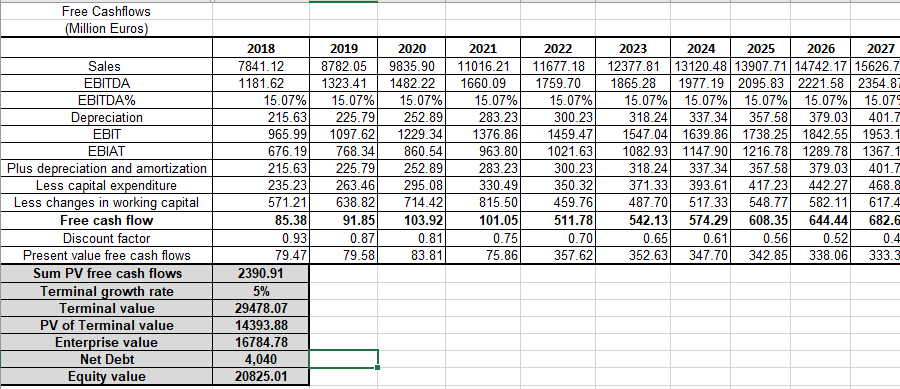
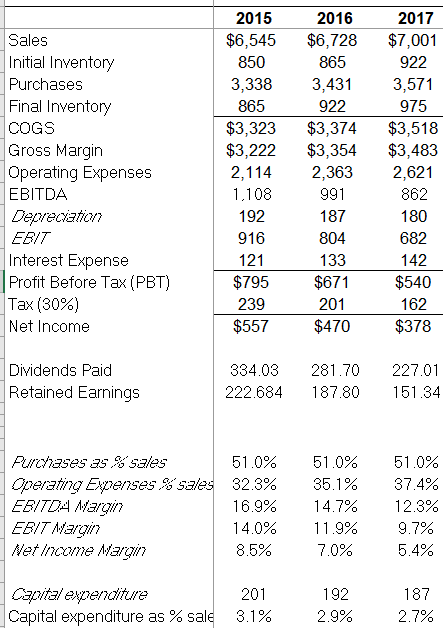
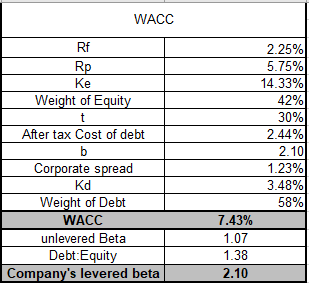
Cash Acc. Receivable Inventory Current Assets Fixed Assets Total Assets Banks (debt) Acc. Payable Deferred Taxes Current Liabilities Long Term Debt Total Liabilities Shareholders equity Total Liabilities & Net Worth 2015 584 3,928 865 5,377 1,870 7,247 2,027 992 40 3,059 2,010 5,069 2,178 7.247 2015 3801.06 58% 2016 634 4,453 922 6,009 1,805 7,814 2,436 951 20 3,407 2,041 5,448 2.366 7,814 2016 4424.26 66% 2017 773 4,600 975 6,348 1,741 8.089 2,741 749 9 3,499 2,072 5,571 2,517 8,089 2017 4825.46 69% NWC NWC from sales % Growth in NWC Change in WC 2018 5396.67 69% -0.1% 571.21 2019 6035.49 69% -0.1% 638.82 2020 6749.91 69% -0.1% 714.42 2021 7565.41 69% 0.05% 815.50 2022 8025.17 69% 0.05% 459.76 2023 8512.87 69% 0.05% 487.70 2024 9030.20 69% 0.05% 517.33 2025 9578.97 69% 0.05% 548.77 2026 10161.08 69% 0.05% 582.11 2027 10778.56 69% 0.05% 617.48 623.20 401.19 % Sales in Industry Book Value Equity Market Capitalization Debt EV EBITDA Net Income Levered Beta Debt/Equity EV/EBITDA P/E 0.48 0.75 Burger Corp Small Mac Co Fingers Corp Shrimper Corp Clairon Corp Cod Corp Myfish Corp Azuzena Corp 4,050 82.00% 65.00% 67.00% 81.00% 10.00% 87.00% 78.00% 56.00% 10,080 10,667 10,641 1,752 2,667 5,538 9,429 10,818 25,200 4,800 30.000 32,000 8,000 40,000 18,090 18,090 3,680 370 7,200 3,800 11,000 7,200 6,800 14.000 6.600 6.400 13,000 11,900 3,590 15,490 3,650 4,050 1,990 920 1,200 925 1.100 1,700 2,016 1,920 2,714 800 864 1,152 201 1.25 1.67 2.30 2.70 2.00 1.40 1 87 1.67 Unlevered Beta 0.94 1.10 2.30 2.35 1.00 0.75 1.27 1.36 0.00 0.21 1.43 1.23 0.68 0.33 8.22 9.88 9.09 4.40 9.17 15.14 11.82 9.11 12.50 16.67 6.67 4.60 8.33 6.25 32.84 7.44 1,599 PIE 7.63 Pirce/Earnings Net Income Implied Equity value $378 $2,887.52 EV/EBITDA EV/EBITDA EBITDA 17 Implied EV 9.60 862.49 8282.07 Free Cashflows (Million Euros) Sales EBITDA EBITDA% Depreciation EBIT EBIAT Plus depreciation and amortization Less capital expenditure Less changes in working capital Free cash flow Discount factor Present value free cash flows Sum PV free cash flows Terminal growth rate Terminal value PV of Terminal value Enterprise value Net Debt Equity value 2018 7841.12 1181.62 15.07% 215.63 965.99 676.19 215.63 235.23 571.21 85.38 0.93 79.47 2390.91 5% 29478.07 14393.88 16784.78 4,040 20825.01 2019 8782.05 1323.41 15.07% 225.79 1097.62 768.34 225.79 263.46 638.82 91.85 0.87 79.58 2020 9835.90 1482.22 15.07% 252.89 1229.34 860.54 252.89 295.08 714.42 103.92 2021 11016.21 1660.09 15.07% 283.23 1376.86 963.80 283.23 330.49 815.50 101.05 0.75 75.86 2022 11677.18 1759.70 15.07% 300.23 1459.47 1021.63 300.23 350.32 459.76 511.78 0.70 357.62 2023 2024 2025 2026 2027 12377.81 13120.48 13907.71 14742.17 15626.7 1865.28 1977.19 2095.83 2221.58 2354.8 15.07% 15.07% 15.07% 15.07% 15.07 318.24 337.34 357.58 379.03 401.7 1547.04 1639.86 1738.25 1842.55 1953.1 1082.93 1147.90 1216.78 1289.78 1367.1 318.24 337.34 357.58 379.03 401.7 371.33 393.61 417.23 442.27 468.& 487.70 517.33 548.77 582.11 617.4 542.13 574.29 608.35 644.44 682.6 0.65 0.61 0.56 0.52 352.63 347.701 342.85 338.06 333.3 0.81 0.4 83.81 Sales Initial Inventory Purchases Final Inventory COGS Gross Margin Operating Expenses EBITDA Depreciation EBIT Interest Expense Profit Before Tax (PBT) Tax (30%) Net Income 2015 $6,545 850 3,338 865 $3,323 $3,222 2,114 1,108 192 916 121 $795 239 $557 2016 $6,728 865 3,431 922 $3,374 $3,354 2,363 991 187 804 133 $671 201 $470 2017 $7,001 922 3,571 975 $3,518 $3,483 2,621 862 180 682 142 $540 162 $378 Dividends Paid Retained Earnings 334.03 222.684 281.70 187.80 227.01 151.34 Purchases as % sales 51.0% Operating Expenses & sales 32.3% EBITDA Margin 16.9% EBIT Margin 14.0% Net Income Margin 8.5% 51.0% 35.1% 14.7% 11.9% 7.0% 51.0% 37.4% 12.3% 9.7% 5.4% Capital expenditure Capital expenditure as % sale 201 3.1% 192 2.9% 187 2.7% WACC Rf Rp Weight of Equity t After tax Cost of debt b Corporate spread Kd Weight of Debt WACC unlevered Beta Debt:Equity Company's levered beta 2.25% 5.75% 14.33% 42% 30% 2.44% 2.10 1.23% 3.48% 58% 7.43% 1.07 1.38 2.10 Cash Acc. Receivable Inventory Current Assets Fixed Assets Total Assets Banks (debt) Acc. Payable Deferred Taxes Current Liabilities Long Term Debt Total Liabilities Shareholders equity Total Liabilities & Net Worth 2015 584 3,928 865 5,377 1,870 7,247 2,027 992 40 3,059 2,010 5,069 2,178 7.247 2015 3801.06 58% 2016 634 4,453 922 6,009 1,805 7,814 2,436 951 20 3,407 2,041 5,448 2.366 7,814 2016 4424.26 66% 2017 773 4,600 975 6,348 1,741 8.089 2,741 749 9 3,499 2,072 5,571 2,517 8,089 2017 4825.46 69% NWC NWC from sales % Growth in NWC Change in WC 2018 5396.67 69% -0.1% 571.21 2019 6035.49 69% -0.1% 638.82 2020 6749.91 69% -0.1% 714.42 2021 7565.41 69% 0.05% 815.50 2022 8025.17 69% 0.05% 459.76 2023 8512.87 69% 0.05% 487.70 2024 9030.20 69% 0.05% 517.33 2025 9578.97 69% 0.05% 548.77 2026 10161.08 69% 0.05% 582.11 2027 10778.56 69% 0.05% 617.48 623.20 401.19 % Sales in Industry Book Value Equity Market Capitalization Debt EV EBITDA Net Income Levered Beta Debt/Equity EV/EBITDA P/E 0.48 0.75 Burger Corp Small Mac Co Fingers Corp Shrimper Corp Clairon Corp Cod Corp Myfish Corp Azuzena Corp 4,050 82.00% 65.00% 67.00% 81.00% 10.00% 87.00% 78.00% 56.00% 10,080 10,667 10,641 1,752 2,667 5,538 9,429 10,818 25,200 4,800 30.000 32,000 8,000 40,000 18,090 18,090 3,680 370 7,200 3,800 11,000 7,200 6,800 14.000 6.600 6.400 13,000 11,900 3,590 15,490 3,650 4,050 1,990 920 1,200 925 1.100 1,700 2,016 1,920 2,714 800 864 1,152 201 1.25 1.67 2.30 2.70 2.00 1.40 1 87 1.67 Unlevered Beta 0.94 1.10 2.30 2.35 1.00 0.75 1.27 1.36 0.00 0.21 1.43 1.23 0.68 0.33 8.22 9.88 9.09 4.40 9.17 15.14 11.82 9.11 12.50 16.67 6.67 4.60 8.33 6.25 32.84 7.44 1,599 PIE 7.63 Pirce/Earnings Net Income Implied Equity value $378 $2,887.52 EV/EBITDA EV/EBITDA EBITDA 17 Implied EV 9.60 862.49 8282.07 Free Cashflows (Million Euros) Sales EBITDA EBITDA% Depreciation EBIT EBIAT Plus depreciation and amortization Less capital expenditure Less changes in working capital Free cash flow Discount factor Present value free cash flows Sum PV free cash flows Terminal growth rate Terminal value PV of Terminal value Enterprise value Net Debt Equity value 2018 7841.12 1181.62 15.07% 215.63 965.99 676.19 215.63 235.23 571.21 85.38 0.93 79.47 2390.91 5% 29478.07 14393.88 16784.78 4,040 20825.01 2019 8782.05 1323.41 15.07% 225.79 1097.62 768.34 225.79 263.46 638.82 91.85 0.87 79.58 2020 9835.90 1482.22 15.07% 252.89 1229.34 860.54 252.89 295.08 714.42 103.92 2021 11016.21 1660.09 15.07% 283.23 1376.86 963.80 283.23 330.49 815.50 101.05 0.75 75.86 2022 11677.18 1759.70 15.07% 300.23 1459.47 1021.63 300.23 350.32 459.76 511.78 0.70 357.62 2023 2024 2025 2026 2027 12377.81 13120.48 13907.71 14742.17 15626.7 1865.28 1977.19 2095.83 2221.58 2354.8 15.07% 15.07% 15.07% 15.07% 15.07 318.24 337.34 357.58 379.03 401.7 1547.04 1639.86 1738.25 1842.55 1953.1 1082.93 1147.90 1216.78 1289.78 1367.1 318.24 337.34 357.58 379.03 401.7 371.33 393.61 417.23 442.27 468.& 487.70 517.33 548.77 582.11 617.4 542.13 574.29 608.35 644.44 682.6 0.65 0.61 0.56 0.52 352.63 347.701 342.85 338.06 333.3 0.81 0.4 83.81 Sales Initial Inventory Purchases Final Inventory COGS Gross Margin Operating Expenses EBITDA Depreciation EBIT Interest Expense Profit Before Tax (PBT) Tax (30%) Net Income 2015 $6,545 850 3,338 865 $3,323 $3,222 2,114 1,108 192 916 121 $795 239 $557 2016 $6,728 865 3,431 922 $3,374 $3,354 2,363 991 187 804 133 $671 201 $470 2017 $7,001 922 3,571 975 $3,518 $3,483 2,621 862 180 682 142 $540 162 $378 Dividends Paid Retained Earnings 334.03 222.684 281.70 187.80 227.01 151.34 Purchases as % sales 51.0% Operating Expenses & sales 32.3% EBITDA Margin 16.9% EBIT Margin 14.0% Net Income Margin 8.5% 51.0% 35.1% 14.7% 11.9% 7.0% 51.0% 37.4% 12.3% 9.7% 5.4% Capital expenditure Capital expenditure as % sale 201 3.1% 192 2.9% 187 2.7% WACC Rf Rp Weight of Equity t After tax Cost of debt b Corporate spread Kd Weight of Debt WACC unlevered Beta Debt:Equity Company's levered beta 2.25% 5.75% 14.33% 42% 30% 2.44% 2.10 1.23% 3.48% 58% 7.43% 1.07 1.38 2.10