Please do the following:
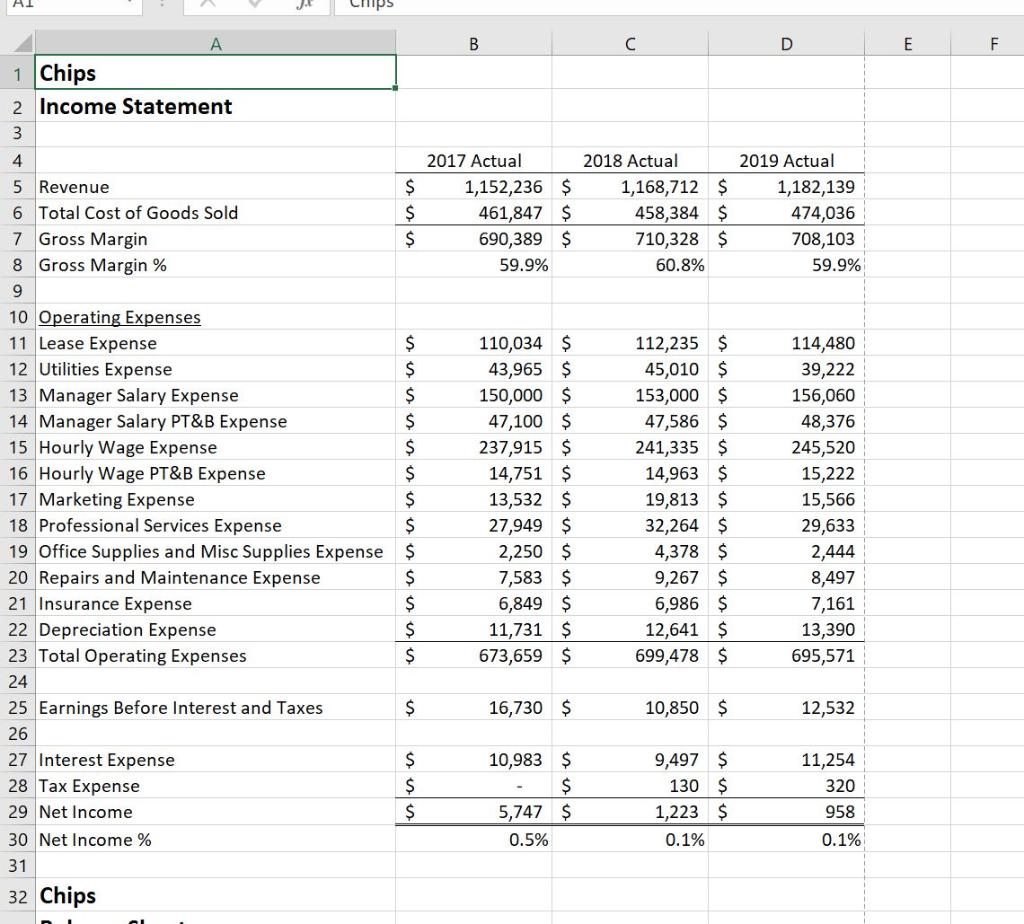
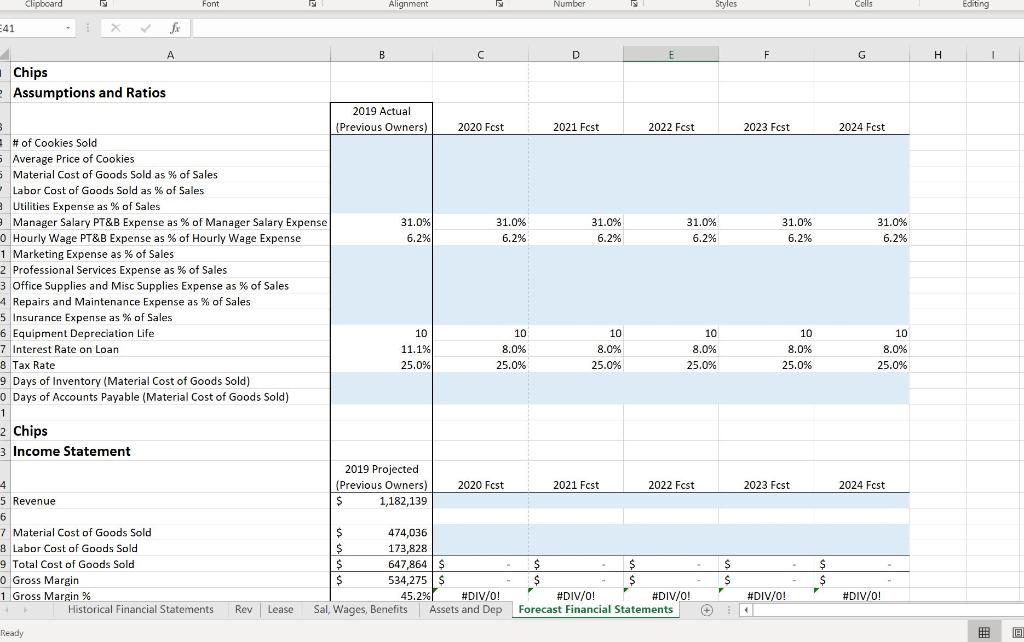
- Calculate all of the ratios for the Actual Financial Statements for 2019 listed at the top of the "Forecast Financial Statement" tab of the spreadsheet. Some of the information needed is on other tabs in the spreadsheet.
For the forecast years (20202024), use the following assumptions to fill in the missing forecast calculations (do not change the calculations that the CFO has already completed):
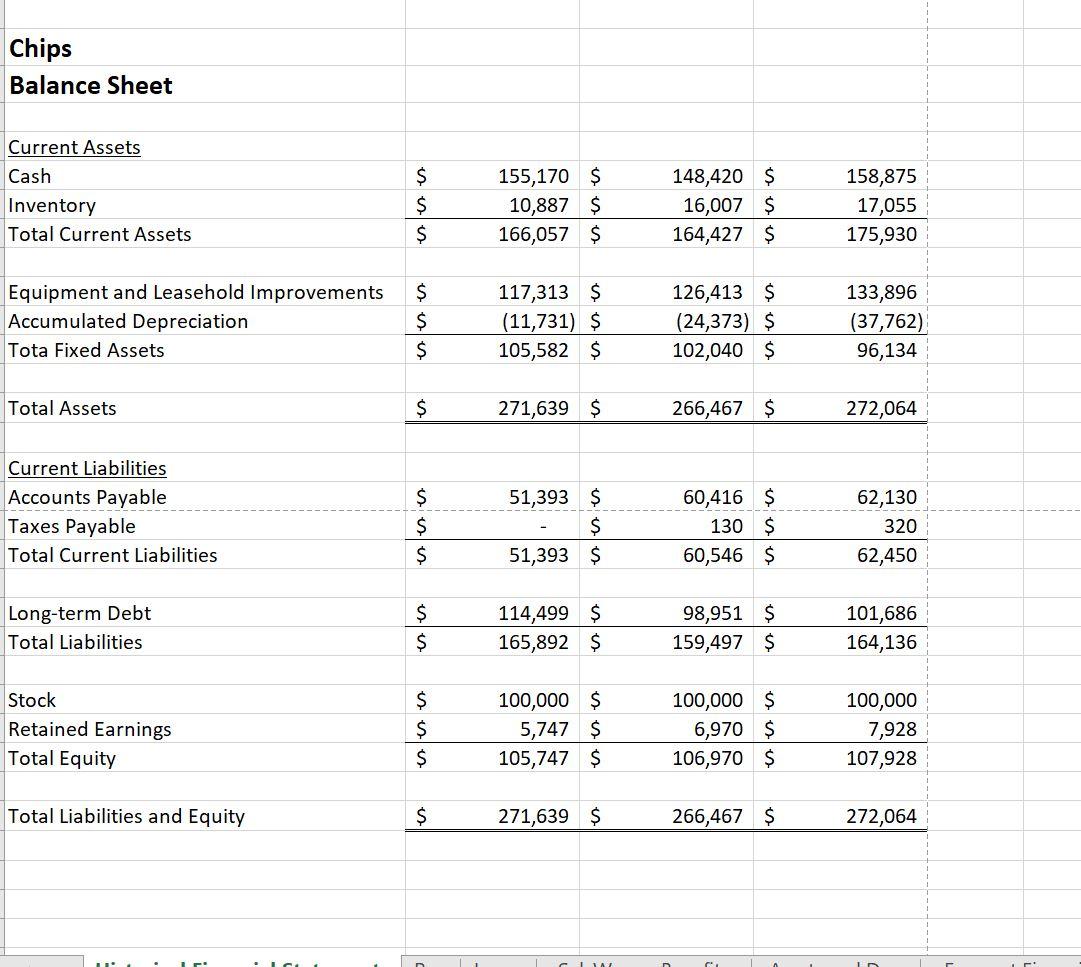
- The total number of cookies sold increases by 4.0% each year.
- Average price of cookies remains flat each year (no change).
- The material cost of goods sold as a % of sales increases by 2.5% each year.
- The labor cost of goods sold as a % of sales increases by 2.5% each year.
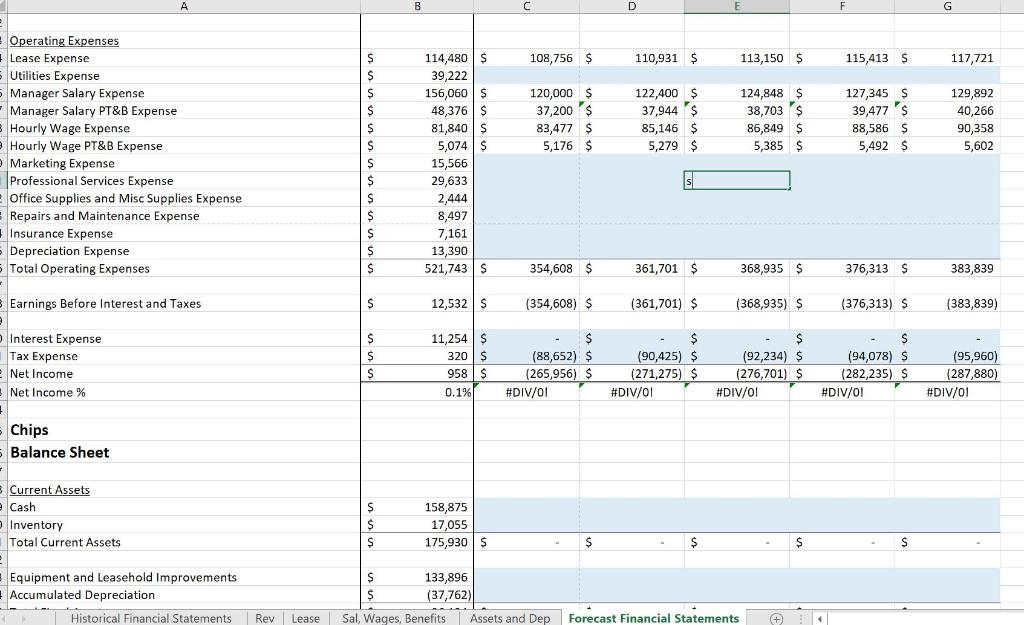
- All operating expenses as a % of sales remain flat each year (no change).
- Days of inventory decreases by 1.0% each year (Days of inventory is calculated using Material Cost of Goods Sold - do not use Total Cost of Goods Sold for your calculation).
- Days of accounts payable go down by 2.0% each year (Days of accounts payable is calculated using Material Cost of Goods Sold - do not use Total Cost of Goods Sold for your calculation).
- Cash balance increases by 4.0% each year until the last year of the forecast. In the last year of the forecast (2024), the loan should go to zero. In that year, cash becomes the new "plug" to make the balance sheet balance.
- On January 1, 2021 purchase $85,000 of new equipment. Equipment has a 10-year life, with no salvage value. Depreciation is expensed using the straight-line method. All other assets and depreciation stay the same for the forecasted future.
- Taxes payable is equal to tax expense for the year.
- No further investments (stock) in the companykeep the same as in 2019.
- Retained earnings for 2020 consist only of 2020 net profit (start over as a new company). No dividends are projected. Subsequent years should follow the standard equation of Last Year's Retained Earnings plus the Current Year's Net Income. No dividends are projected.
- Long-term debt should be calculated to balance the balance sheet (except in 2024, when cash will be used as the "plug" to balance the balance sheet).
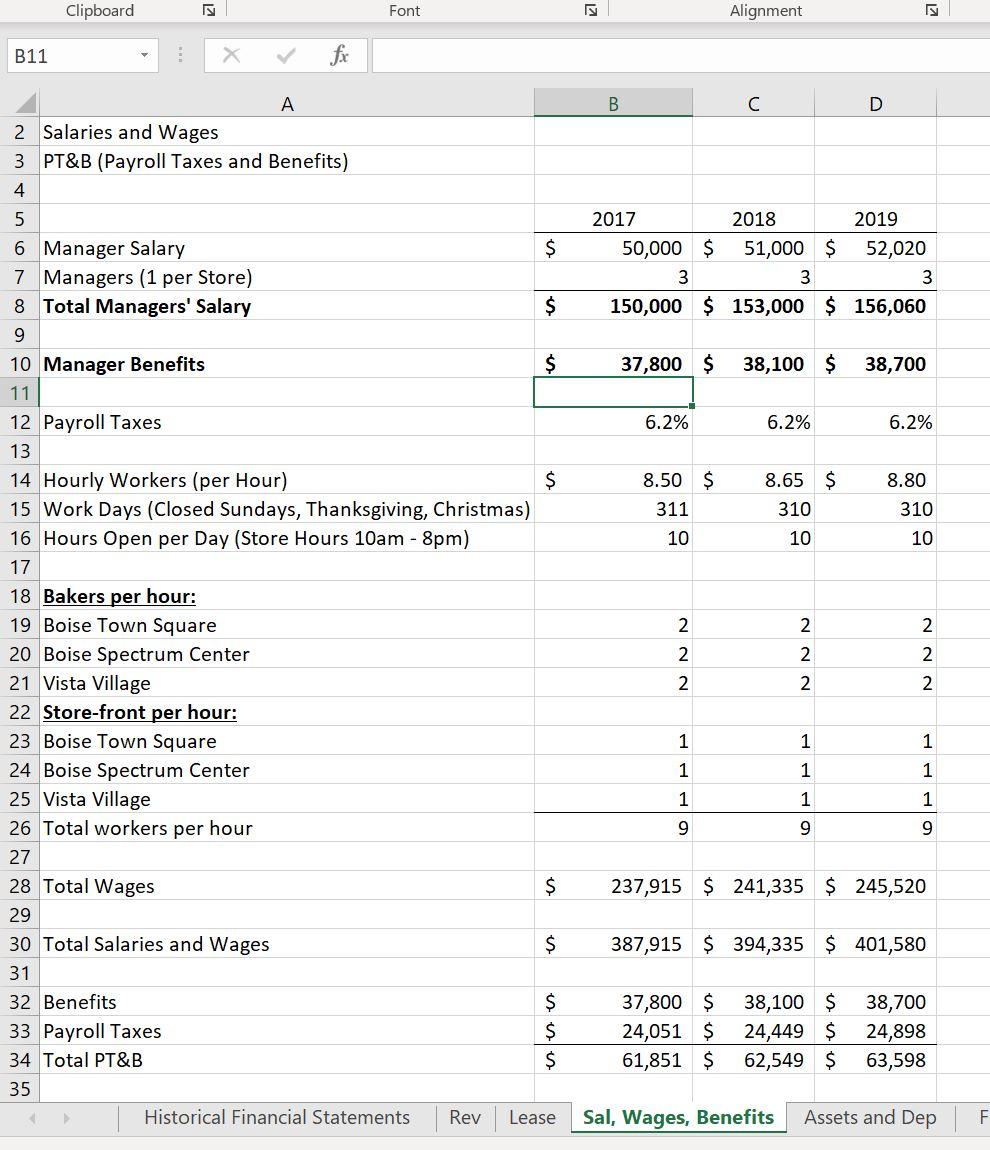
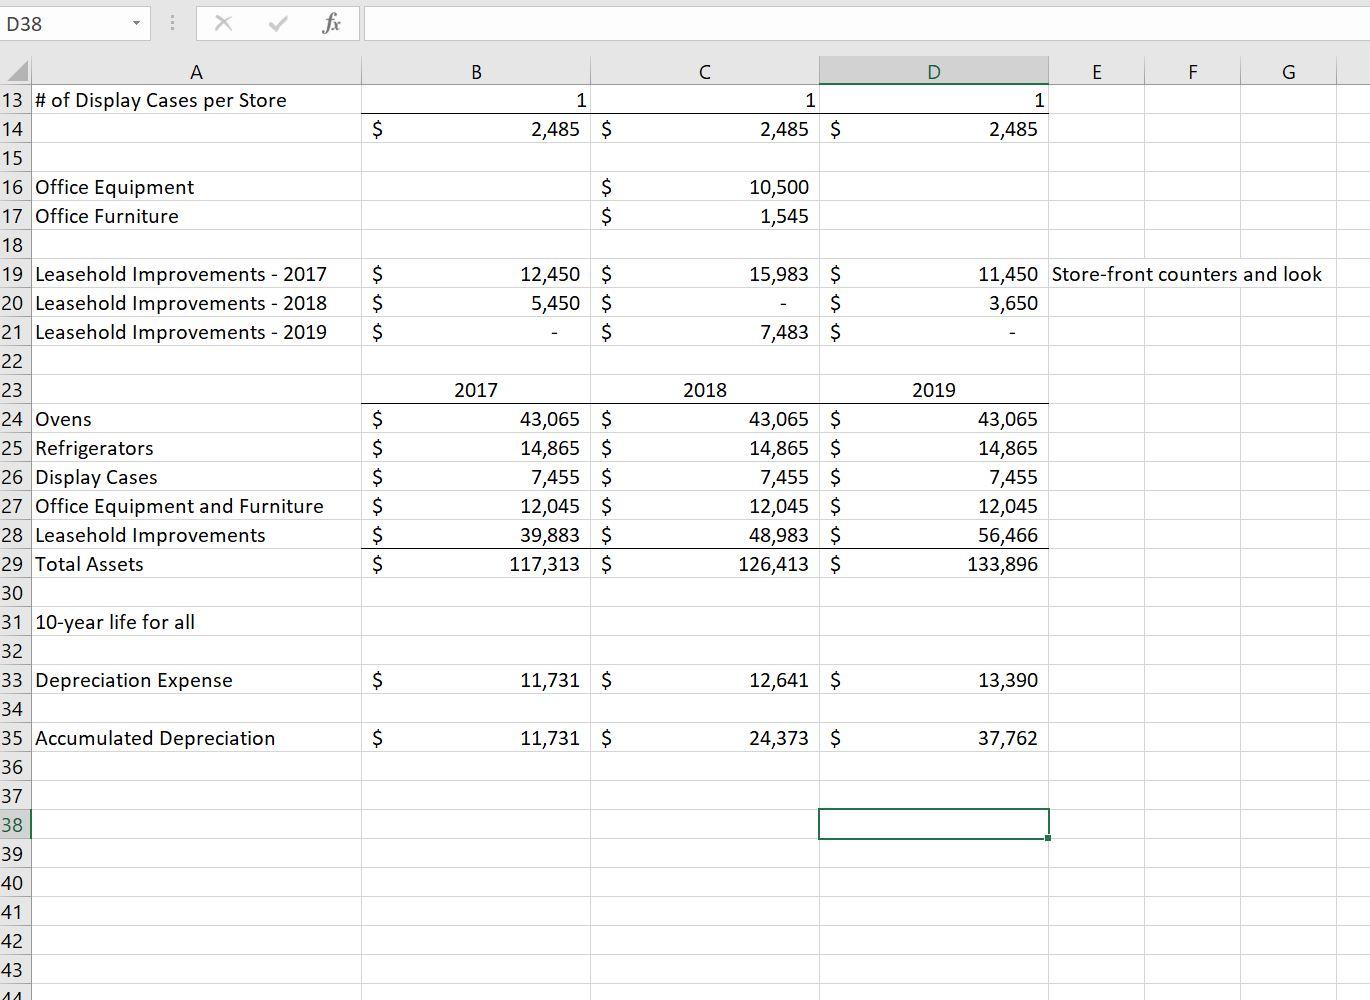
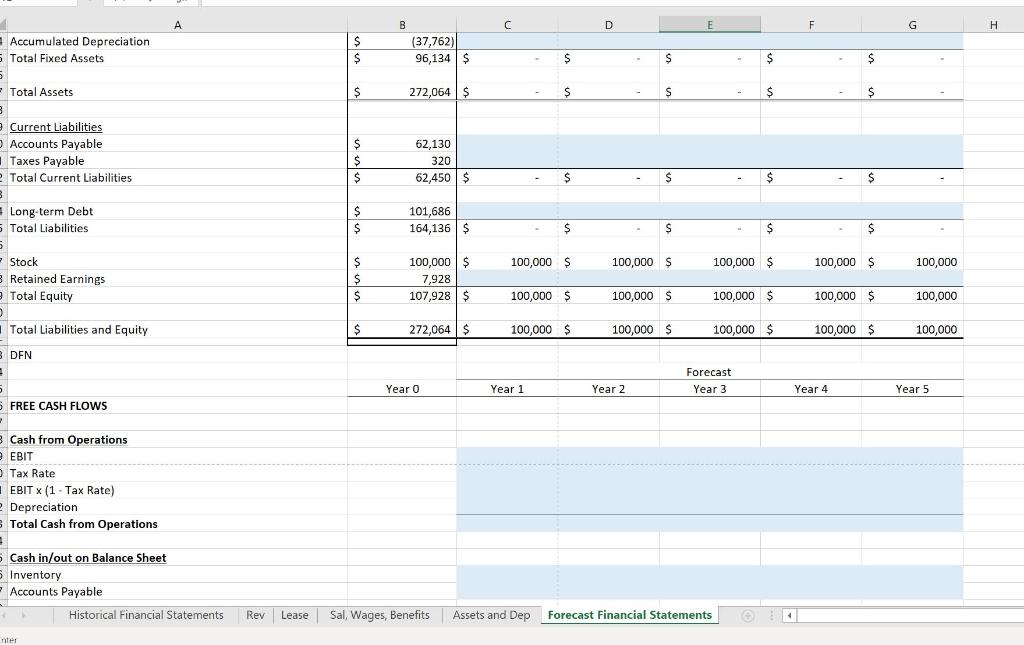
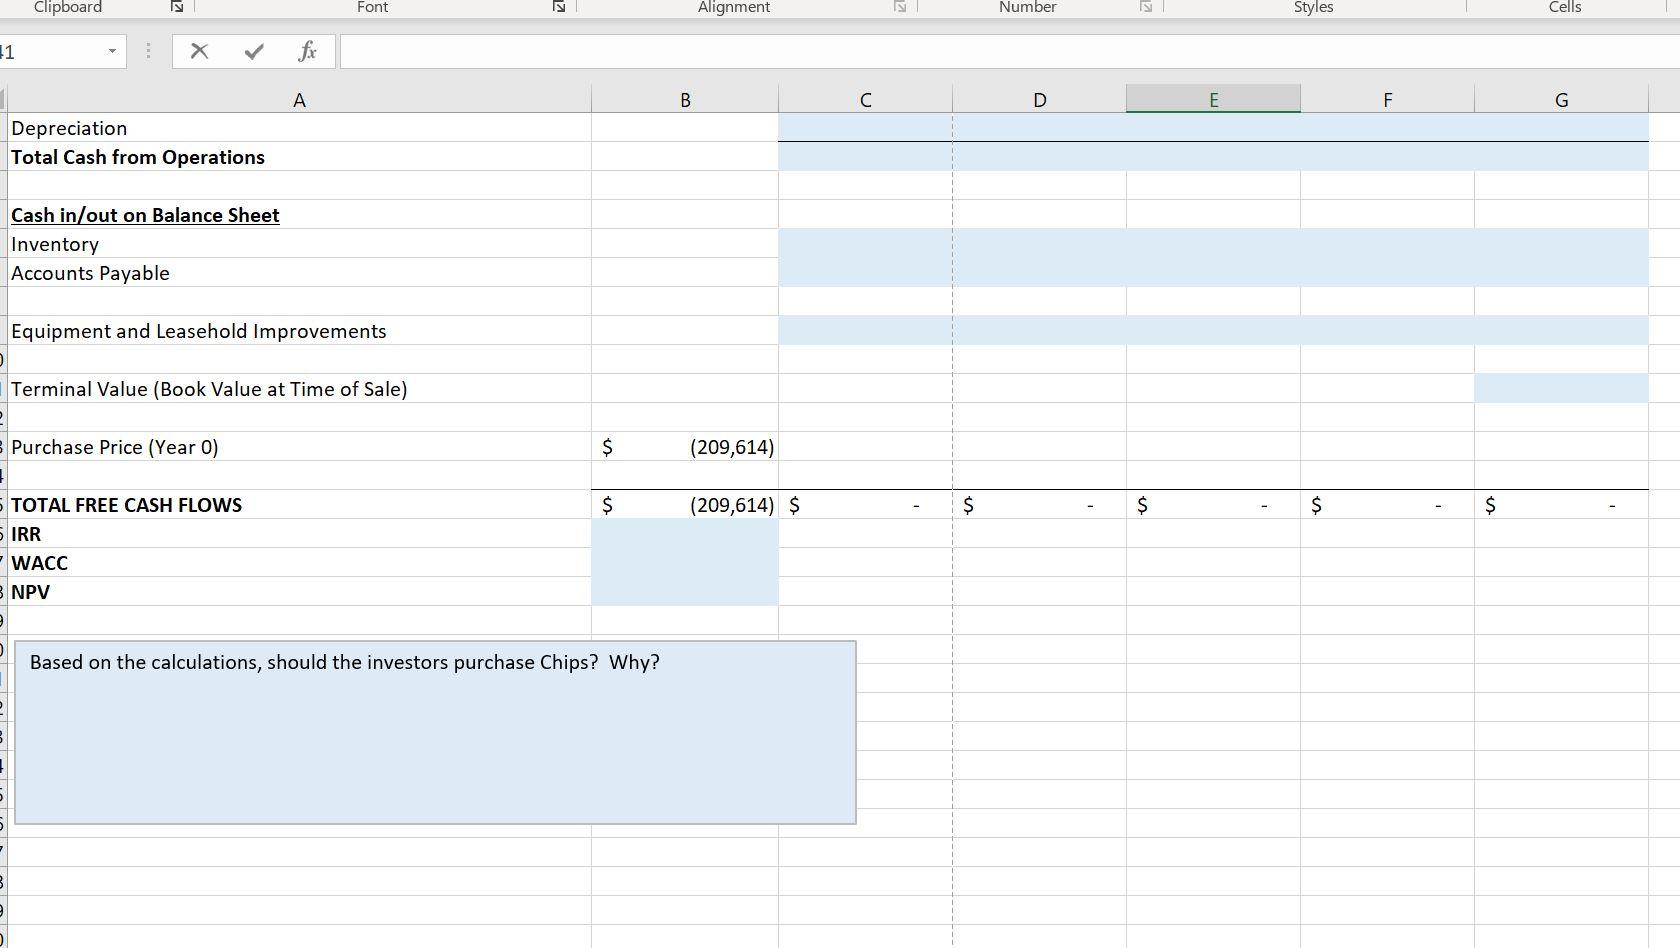
AL Chips A B C D E F $ $ $ 2017 Actual 1,152,236 $ 461,847 $ 690,389 $ 59.9% 2018 Actual 1,168,712 $ 458,384 $ 710,328 $ 60.8% 2019 Actual 1,182,139 474,036 708,103 59.9% 1 Chips 2 Income Statement 3 4 5 Revenue 6 Total Cost of Goods Sold 7 Gross Margin 8 Gross Margin % 9 10 Operating Expenses 11 Lease Expense 12 Utilities Expense 13 Manager Salary Expense 14 Manager Salary PT&B Expense 15 Hourly Wage Expense 16 Hourly Wage PT&B Expense 17 Marketing Expense 18 Professional Services Expense 19 Office Supplies and Misc Supplies Expense 20 Repairs and Maintenance Expense 21 Insurance Expense 22 Depreciation Expense 23 Total Operating Expenses 24 25 Earnings Before Interest and Taxes 26 27 Interest Expense 28 Tax Expense 29 Net Income 30 Net Income % 31 32 Chips $ $ $ $ $ $ $ 110,034 $ 43,965 $ 150,000 $ 47,100 $ 237,915 $ 14,751 $ 13,532 $ 27,949 $ 2,250 $ 7,583 $ 6,849 $ 11,731 $ 673,659 $ 112,235 $ 45,010 $ 153,000 $ 47,586 $ 241,335 $ 14,963 $ 19,813 $ 32,264 $ 4,378 $ 9,267 $ 6,986 $ 12,641 $ 699,478 $ 114,480 39,222 156,060 48,376 245,520 15,222 15,566 29,633 2,444 8,497 7,161 13,390 695,571 $ $ $ $ $ $ $ 16,730 $ 10,850 $ 12,532 S $ $ 10,983 $ $ 5,747 $ 0.5% 9,497 $ 130 $ 1,223 $ 0.1% 11,254 320 958 0.1% Chips Balance Sheet Current Assets Cash Inventory Total Current Assets $ $ $ 155,170 $ 10,887 $ 166,057 $ 148,420 $ 16,007 $ 164,427 $ 158,875 17,055 175,930 Equipment and Leasehold Improvements Accumulated Depreciation Tota Fixed Assets $ $ $ 117,313 $ (11,731) $ 105,582 $ 126,413 $ (24,373) $ 102,040 $ 133,896 (37,762) 96,134 Total Assets $ 271,639 $ 266,467 $ 272,064 Current Liabilities Accounts Payable Taxes Payable Total Current Liabilities $ $ $ 51,393 $ $ 51,393 $ 60,416 $ 130 $ 60,546 $ 62,130 320 62,450 Long-term Debt Total Liabilities $ $ 114,499 $ 165,892 $ 98,951 $ 159,497 $ 101,686 164,136 Stock Retained Earnings Total Equity $ $ $ 100,000 $ 5,747 $ 105,747 $ 100,000 $ 6,970 $ 106,970 $ 100,000 7,928 107,928 Total Liabilities and Equity $ 271,639 $ 266,467 $ 272,064 I. ITA Clipboard KI Font 12 39 X fr B C D A - Vista Village Indvidual Units Box Units 5 Total Cookies 5 Individual Revenue B Box Revenue Total Revenue 49,945 25,283 151,077 48,483 26,496 154,467 45,983 27,143 154,555 $ $ $ 149,835 $ 145,449 $ 137,949 252,830 $ $ 264,960 $ 271,430 402,665 $ $ 410,409 $ 409,379 149,472 70,382 431,000 147,724 72,554 437,940 136,963 77,125 445,463 I Total Indvidual Units Box Units Total Cookies 5 5 Individual Revenue Box Revenue 3 Total Revenue $ 448,416 $ $ 443,172 $ 410,889 $ 703,820 $ $ 725,540 $ 771,250 $ $ 1,152,236 $ 1,168,712 $1,182,139 1 2 Clipboard Font Alignment is Num 21 : fr A B D E Chips Leases Lease Period Square Footage Cost/Sq. Foot/mth Cost per Month Cost per Year Cost Increase per Year Boise Town Square Boise Spectrum Center 10 years (2017-2026) 10 years (2017-2026) 1450 1900 $ 2.05 1.88 $ 2,972.50 $ 3,572.00 $ $ 35,670.00 $ 42,864.00 $ 2.0% 2.0% Vista Village 10 years (2017-2026) 1500 1.75 2,625.00 31,500.00 2.0% Note: Boise Spectrum Center also includes company office space Clipboard Font ET Alignment B11 B D 2017 2018 2019 50,000 $ 51,000 $ 52,020 3 3 3 150,000 $ 153,000 $ 156,060 37,800 $ 38,100 $ 38,700 6.2% 6.2% 6.2% 8.80 8.50 $ 311 10 8.65 $ 310 10 310 10 A 2 Salaries and Wages 3 PT&B (Payroll Taxes and Benefits) 4 5 6 Manager Salary $ 7 Managers (1 per Store) 8 Total Managers' Salary $ 9 10 Manager Benefits $ 11 12 Payroll Taxes 13 14 Hourly Workers (per Hour) $ 15 Work Days (Closed Sundays, Thanksgiving, Christmas) 16 Hours Open per Day (Store Hours 10am - 8pm) 17 18 Bakers per hour: 19 Boise Town Square 20 Boise Spectrum Center 21 Vista Village 22 Store-front per hour: 23 Boise Town Square 24 Boise Spectrum Center 25 Vista Village 26 Total workers per hour 27 28 Total Wages $ 29 30 Total Salaries and Wages $ 31 32 Benefits $ 33 Payroll Taxes $ 34 Total PT&B $ 35 Historical Financial Statements Rev Lease 2 2 NNN 2 N 2 2 NNN 2 1 1 1 1 1 1 1 1 1 9 9 9 237,915 $ 241,335 $ 245,520 387,915 $ 394,335 $ 401,580 37,800 $ 24,051 $ 61,851 $ 38,100 $ 24,449 $ 62,549 $ 38,700 24,898 63,598 Sal, Wages, Benefits Assets and Dep F D38 fr A B D E F G 1 1 1 2,485 $ 2,485 $ 2,485 $ $ $ 10,500 1,545 $ $ $ 12,450 $ 5,450 $ $ 15,983 $ $ 7,483 $ 11,450 Store-front counters and look 3,650 2017 2018 2019 13 # of Display Cases per Store 14 15 16 Office Equipment 17 Office Furniture 18 19 Leasehold Improvements - 2017 20 Leasehold Improvements - 2018 21 Leasehold Improvements - 2019 22 23 24 Ovens 25 Refrigerators 26 Display Cases 27 Office Equipment and Furniture 28 Leasehold Improvements 29 Total Assets 30 31 10-year life for all 32 33 Depreciation Expense 34 35 Accumulated Depreciation 36 $ $ $ $ $ $ 43,065 $ 14,865 $ 7,455 $ 12,045 $ 39,883 $ 117,313 $ 43,065 $ 14,865 $ 7,455 $ 12,045 $ 48,983 $ 126,413 $ 43,065 14,865 7,455 12,045 56,466 133,896 $ 11,731 $ 12,641 $ 13,390 $ 11,731 $ 24,373 $ 37,762 37 38 39 40 41 42 43 14 Clipboard Font Alignment Number Styles Cells Editing 241 fx A B D D F G H 1 Chips Assumptions and Ratios 2019 Actual (Previous Owners) 2020 Fest 2021 Fest 2022 Fest 2023 Fest 2024 Fest 31.0% 6.2% 31.0% 6.2% 31.0% 6.2% 31.0% 6.2% 31.0% 6.2% 31.0% 6.2% B # of Cookies Sold # Average Price of Cookies Material Cost of Goods Sold as % of Sales Labor Cost of Goods Sold as % of Sales Utilities Expense as % of Sales Manager Salary PT&B Expense as % of Manager Salary Expense 0 Hourly Wage PT&B Expense as % of Hourly Wage Expense 1 Marketing Expense as % of Sales 2 Professional Services Expense as % of Sales Foression ws 3 Office Supplies and Misc Supplies Expense as % of Sales resupp 4 Repairs and Maintenance Expense as % of Sales ens 5 Insurance Expense as % of Sales 6 Equipment Depreciation Life 7 Interest Rate on Loan 8 Tax Rate 9 Days of Inventory (Material Cost of Goods Sold) 0 Days of Accounts Payable (Material Cost of Goods Sold) 1 2 Chips 3 Income Statement 10 11.1% % 25.0%) 10 8.0% 25.0% 10 8.0% 25.0% 10 8.0% 25.0% 10 8.0% 25.0% 10 8.0% 25.0% 2019 Projected (Previous Owners) $ 1,182,139 2020 Fcst 2021 Fest 2022 Fest 2023 Fest 2024 Fest 4 5 Revenue 6 7 Material Cost of Goods Sold 8 Labor Cost of Goods Sold 9 Total Cost of Goods Sold O Gross Margin 1 Gross Margin % Historical Financial Statements $ 474,036 $ 173,828 $ 647,864 $ $ 534,275$ 45.2% #DIV/0! Sal, Wages, Benefits Assets and Dep $ $ $ #DIV/0! #DIV/0! #DIV/0! Forecast Financial Statements #DIV/0! Rev Lease + Ready le A B C D E F G 108,756 $ 110,931 $ 113,150 $ 115,413 $ 117,721 $ S S $ $ $ s 120,000 $ 37,200S 83,477 $ 5,176 $ 122.400 $ 37,944 $ 85,146 $ 5,279 $ 124,848 $ 38.703 86,849 $ 5,385 $ 127,345 S 39,477 'S 88,586 $ 5,492 $ Operating Expenses Lease Expense Utilities Expense Manager Salary Expense - Manager Salary PT&B Expense 3 Hourly Wage Expense Hourly Wage PT&B Expense Marketing Expense Professional Services Expense Office Supplies and Misc Supplies Expense Repairs and Maintenance Expense Insurance Expense Depreciation Expense Total Operating Expenses 129,892 40,266 90,358 5,602 114,480 S 39,222 156,060 S 48,376S 81,840 S 5,074 $ 15,566 29,633 2,444 8,497 7,161 13,390 521,743S s $ S S S S S 354,608 $ 361,701 $ 368,935 $ 376,313 S 383,839 Earnings Before Interest and Taxes S 12,532 S (354,608) $ (361,701) $ (368,935) $ (376,313) S (383,839) Interest Expense Tax Expense Net Income Net Income % $ $ $ 11,254 S 320 S S 958S 0.1% $ (88,652) $ (265,956) $ #DIV/01 $ $ (90,425) $ (271,275) $ #DIV/01 $ (92,234) $ (276,701) $ #DIV/01 $ (94,078) $ (282,235) $ (95,960) (287,880) ( #DIV/01 #DIV/01 Chips Balance Sheet Current Assets Cash Inventory Total Current Assets S $ S 158,875 17,055 175,930$ $ $ $ S Equipment and Leasehold Improvements Accumulated Depreciation Historical Financial Statements S 133,896 $ (37,762) LA Sal, Wages, Benefits Assets and Dep Rev Lease Forecast Financial Statements A D E F G H $ $ B (37,762) 96,134 $ $ S $ $ $ 272,064 $ $ $ $ $ Accumulated Depreciation 5 Total Fixed Assets 5 Total Assets 3 Current Liabilities Accounts Payable Taxes Payable Total Current Liabilities 3 3 Long-term Debt Total Liabilities 62,130 $ $ $ 320 62,450 $ $ $ $ $ $ $ $ 101,686 164,136 $ $ S $ $ 100,000 $ 100,000 $ 100,000 $ 100,000 $ 100,000 - Stock 3 Retained Earnings Total Equity . Total Liabilities and Equity $ $ $ 100,000 $ 7,928 107,928 $ 100,000 $ 100,000 $ 100,000 $ 100,000 $ 100,000 $ 272,064 $ 100,000 $ 100,000 $ 100,000 $ 100,000 $ 100,000 B DEN Forecast Year 3 Year o Year 1 Year 2 Year 4 Year 5 S FREE CASH FLOWS - Cash from Operations EBIT Tax Rate EBIT X (1 - Tax Rate) 2 Depreciation 3 Total Cash from Operations 5 Cash in/out on Balance Sheet 5 Inventory - Accounts Payable Historical Financial Statements Rev Lease Sal Wages, Benefits Assets and Dep Forecast Financial Statements nes Clipboard Font Alignment Number Styles Cells 11 A B C D E F G Depreciation Total Cash from Operations Cash in/out on Balance Sheet Inventory Accounts Payable Equipment and Leasehold Improvements Terminal Value (Book Value at Time of Sale) Purchase Price (Year O) $ (209,614) $ (209,614) $ $ $ - $ $ TOTAL FREE CASH FLOWS IRR - WACC 3 NPV Based on the calculations, should the investors purchase Chips? Why? AL Chips A B C D E F $ $ $ 2017 Actual 1,152,236 $ 461,847 $ 690,389 $ 59.9% 2018 Actual 1,168,712 $ 458,384 $ 710,328 $ 60.8% 2019 Actual 1,182,139 474,036 708,103 59.9% 1 Chips 2 Income Statement 3 4 5 Revenue 6 Total Cost of Goods Sold 7 Gross Margin 8 Gross Margin % 9 10 Operating Expenses 11 Lease Expense 12 Utilities Expense 13 Manager Salary Expense 14 Manager Salary PT&B Expense 15 Hourly Wage Expense 16 Hourly Wage PT&B Expense 17 Marketing Expense 18 Professional Services Expense 19 Office Supplies and Misc Supplies Expense 20 Repairs and Maintenance Expense 21 Insurance Expense 22 Depreciation Expense 23 Total Operating Expenses 24 25 Earnings Before Interest and Taxes 26 27 Interest Expense 28 Tax Expense 29 Net Income 30 Net Income % 31 32 Chips $ $ $ $ $ $ $ 110,034 $ 43,965 $ 150,000 $ 47,100 $ 237,915 $ 14,751 $ 13,532 $ 27,949 $ 2,250 $ 7,583 $ 6,849 $ 11,731 $ 673,659 $ 112,235 $ 45,010 $ 153,000 $ 47,586 $ 241,335 $ 14,963 $ 19,813 $ 32,264 $ 4,378 $ 9,267 $ 6,986 $ 12,641 $ 699,478 $ 114,480 39,222 156,060 48,376 245,520 15,222 15,566 29,633 2,444 8,497 7,161 13,390 695,571 $ $ $ $ $ $ $ 16,730 $ 10,850 $ 12,532 S $ $ 10,983 $ $ 5,747 $ 0.5% 9,497 $ 130 $ 1,223 $ 0.1% 11,254 320 958 0.1% Chips Balance Sheet Current Assets Cash Inventory Total Current Assets $ $ $ 155,170 $ 10,887 $ 166,057 $ 148,420 $ 16,007 $ 164,427 $ 158,875 17,055 175,930 Equipment and Leasehold Improvements Accumulated Depreciation Tota Fixed Assets $ $ $ 117,313 $ (11,731) $ 105,582 $ 126,413 $ (24,373) $ 102,040 $ 133,896 (37,762) 96,134 Total Assets $ 271,639 $ 266,467 $ 272,064 Current Liabilities Accounts Payable Taxes Payable Total Current Liabilities $ $ $ 51,393 $ $ 51,393 $ 60,416 $ 130 $ 60,546 $ 62,130 320 62,450 Long-term Debt Total Liabilities $ $ 114,499 $ 165,892 $ 98,951 $ 159,497 $ 101,686 164,136 Stock Retained Earnings Total Equity $ $ $ 100,000 $ 5,747 $ 105,747 $ 100,000 $ 6,970 $ 106,970 $ 100,000 7,928 107,928 Total Liabilities and Equity $ 271,639 $ 266,467 $ 272,064 I. ITA Clipboard KI Font 12 39 X fr B C D A - Vista Village Indvidual Units Box Units 5 Total Cookies 5 Individual Revenue B Box Revenue Total Revenue 49,945 25,283 151,077 48,483 26,496 154,467 45,983 27,143 154,555 $ $ $ 149,835 $ 145,449 $ 137,949 252,830 $ $ 264,960 $ 271,430 402,665 $ $ 410,409 $ 409,379 149,472 70,382 431,000 147,724 72,554 437,940 136,963 77,125 445,463 I Total Indvidual Units Box Units Total Cookies 5 5 Individual Revenue Box Revenue 3 Total Revenue $ 448,416 $ $ 443,172 $ 410,889 $ 703,820 $ $ 725,540 $ 771,250 $ $ 1,152,236 $ 1,168,712 $1,182,139 1 2 Clipboard Font Alignment is Num 21 : fr A B D E Chips Leases Lease Period Square Footage Cost/Sq. Foot/mth Cost per Month Cost per Year Cost Increase per Year Boise Town Square Boise Spectrum Center 10 years (2017-2026) 10 years (2017-2026) 1450 1900 $ 2.05 1.88 $ 2,972.50 $ 3,572.00 $ $ 35,670.00 $ 42,864.00 $ 2.0% 2.0% Vista Village 10 years (2017-2026) 1500 1.75 2,625.00 31,500.00 2.0% Note: Boise Spectrum Center also includes company office space Clipboard Font ET Alignment B11 B D 2017 2018 2019 50,000 $ 51,000 $ 52,020 3 3 3 150,000 $ 153,000 $ 156,060 37,800 $ 38,100 $ 38,700 6.2% 6.2% 6.2% 8.80 8.50 $ 311 10 8.65 $ 310 10 310 10 A 2 Salaries and Wages 3 PT&B (Payroll Taxes and Benefits) 4 5 6 Manager Salary $ 7 Managers (1 per Store) 8 Total Managers' Salary $ 9 10 Manager Benefits $ 11 12 Payroll Taxes 13 14 Hourly Workers (per Hour) $ 15 Work Days (Closed Sundays, Thanksgiving, Christmas) 16 Hours Open per Day (Store Hours 10am - 8pm) 17 18 Bakers per hour: 19 Boise Town Square 20 Boise Spectrum Center 21 Vista Village 22 Store-front per hour: 23 Boise Town Square 24 Boise Spectrum Center 25 Vista Village 26 Total workers per hour 27 28 Total Wages $ 29 30 Total Salaries and Wages $ 31 32 Benefits $ 33 Payroll Taxes $ 34 Total PT&B $ 35 Historical Financial Statements Rev Lease 2 2 NNN 2 N 2 2 NNN 2 1 1 1 1 1 1 1 1 1 9 9 9 237,915 $ 241,335 $ 245,520 387,915 $ 394,335 $ 401,580 37,800 $ 24,051 $ 61,851 $ 38,100 $ 24,449 $ 62,549 $ 38,700 24,898 63,598 Sal, Wages, Benefits Assets and Dep F D38 fr A B D E F G 1 1 1 2,485 $ 2,485 $ 2,485 $ $ $ 10,500 1,545 $ $ $ 12,450 $ 5,450 $ $ 15,983 $ $ 7,483 $ 11,450 Store-front counters and look 3,650 2017 2018 2019 13 # of Display Cases per Store 14 15 16 Office Equipment 17 Office Furniture 18 19 Leasehold Improvements - 2017 20 Leasehold Improvements - 2018 21 Leasehold Improvements - 2019 22 23 24 Ovens 25 Refrigerators 26 Display Cases 27 Office Equipment and Furniture 28 Leasehold Improvements 29 Total Assets 30 31 10-year life for all 32 33 Depreciation Expense 34 35 Accumulated Depreciation 36 $ $ $ $ $ $ 43,065 $ 14,865 $ 7,455 $ 12,045 $ 39,883 $ 117,313 $ 43,065 $ 14,865 $ 7,455 $ 12,045 $ 48,983 $ 126,413 $ 43,065 14,865 7,455 12,045 56,466 133,896 $ 11,731 $ 12,641 $ 13,390 $ 11,731 $ 24,373 $ 37,762 37 38 39 40 41 42 43 14 Clipboard Font Alignment Number Styles Cells Editing 241 fx A B D D F G H 1 Chips Assumptions and Ratios 2019 Actual (Previous Owners) 2020 Fest 2021 Fest 2022 Fest 2023 Fest 2024 Fest 31.0% 6.2% 31.0% 6.2% 31.0% 6.2% 31.0% 6.2% 31.0% 6.2% 31.0% 6.2% B # of Cookies Sold # Average Price of Cookies Material Cost of Goods Sold as % of Sales Labor Cost of Goods Sold as % of Sales Utilities Expense as % of Sales Manager Salary PT&B Expense as % of Manager Salary Expense 0 Hourly Wage PT&B Expense as % of Hourly Wage Expense 1 Marketing Expense as % of Sales 2 Professional Services Expense as % of Sales Foression ws 3 Office Supplies and Misc Supplies Expense as % of Sales resupp 4 Repairs and Maintenance Expense as % of Sales ens 5 Insurance Expense as % of Sales 6 Equipment Depreciation Life 7 Interest Rate on Loan 8 Tax Rate 9 Days of Inventory (Material Cost of Goods Sold) 0 Days of Accounts Payable (Material Cost of Goods Sold) 1 2 Chips 3 Income Statement 10 11.1% % 25.0%) 10 8.0% 25.0% 10 8.0% 25.0% 10 8.0% 25.0% 10 8.0% 25.0% 10 8.0% 25.0% 2019 Projected (Previous Owners) $ 1,182,139 2020 Fcst 2021 Fest 2022 Fest 2023 Fest 2024 Fest 4 5 Revenue 6 7 Material Cost of Goods Sold 8 Labor Cost of Goods Sold 9 Total Cost of Goods Sold O Gross Margin 1 Gross Margin % Historical Financial Statements $ 474,036 $ 173,828 $ 647,864 $ $ 534,275$ 45.2% #DIV/0! Sal, Wages, Benefits Assets and Dep $ $ $ #DIV/0! #DIV/0! #DIV/0! Forecast Financial Statements #DIV/0! Rev Lease + Ready le A B C D E F G 108,756 $ 110,931 $ 113,150 $ 115,413 $ 117,721 $ S S $ $ $ s 120,000 $ 37,200S 83,477 $ 5,176 $ 122.400 $ 37,944 $ 85,146 $ 5,279 $ 124,848 $ 38.703 86,849 $ 5,385 $ 127,345 S 39,477 'S 88,586 $ 5,492 $ Operating Expenses Lease Expense Utilities Expense Manager Salary Expense - Manager Salary PT&B Expense 3 Hourly Wage Expense Hourly Wage PT&B Expense Marketing Expense Professional Services Expense Office Supplies and Misc Supplies Expense Repairs and Maintenance Expense Insurance Expense Depreciation Expense Total Operating Expenses 129,892 40,266 90,358 5,602 114,480 S 39,222 156,060 S 48,376S 81,840 S 5,074 $ 15,566 29,633 2,444 8,497 7,161 13,390 521,743S s $ S S S S S 354,608 $ 361,701 $ 368,935 $ 376,313 S 383,839 Earnings Before Interest and Taxes S 12,532 S (354,608) $ (361,701) $ (368,935) $ (376,313) S (383,839) Interest Expense Tax Expense Net Income Net Income % $ $ $ 11,254 S 320 S S 958S 0.1% $ (88,652) $ (265,956) $ #DIV/01 $ $ (90,425) $ (271,275) $ #DIV/01 $ (92,234) $ (276,701) $ #DIV/01 $ (94,078) $ (282,235) $ (95,960) (287,880) ( #DIV/01 #DIV/01 Chips Balance Sheet Current Assets Cash Inventory Total Current Assets S $ S 158,875 17,055 175,930$ $ $ $ S Equipment and Leasehold Improvements Accumulated Depreciation Historical Financial Statements S 133,896 $ (37,762) LA Sal, Wages, Benefits Assets and Dep Rev Lease Forecast Financial Statements A D E F G H $ $ B (37,762) 96,134 $ $ S $ $ $ 272,064 $ $ $ $ $ Accumulated Depreciation 5 Total Fixed Assets 5 Total Assets 3 Current Liabilities Accounts Payable Taxes Payable Total Current Liabilities 3 3 Long-term Debt Total Liabilities 62,130 $ $ $ 320 62,450 $ $ $ $ $ $ $ $ 101,686 164,136 $ $ S $ $ 100,000 $ 100,000 $ 100,000 $ 100,000 $ 100,000 - Stock 3 Retained Earnings Total Equity . Total Liabilities and Equity $ $ $ 100,000 $ 7,928 107,928 $ 100,000 $ 100,000 $ 100,000 $ 100,000 $ 100,000 $ 272,064 $ 100,000 $ 100,000 $ 100,000 $ 100,000 $ 100,000 B DEN Forecast Year 3 Year o Year 1 Year 2 Year 4 Year 5 S FREE CASH FLOWS - Cash from Operations EBIT Tax Rate EBIT X (1 - Tax Rate) 2 Depreciation 3 Total Cash from Operations 5 Cash in/out on Balance Sheet 5 Inventory - Accounts Payable Historical Financial Statements Rev Lease Sal Wages, Benefits Assets and Dep Forecast Financial Statements nes Clipboard Font Alignment Number Styles Cells 11 A B C D E F G Depreciation Total Cash from Operations Cash in/out on Balance Sheet Inventory Accounts Payable Equipment and Leasehold Improvements Terminal Value (Book Value at Time of Sale) Purchase Price (Year O) $ (209,614) $ (209,614) $ $ $ - $ $ TOTAL FREE CASH FLOWS IRR - WACC 3 NPV Based on the calculations, should the investors purchase Chips? Why