Answered step by step
Verified Expert Solution
Question
1 Approved Answer
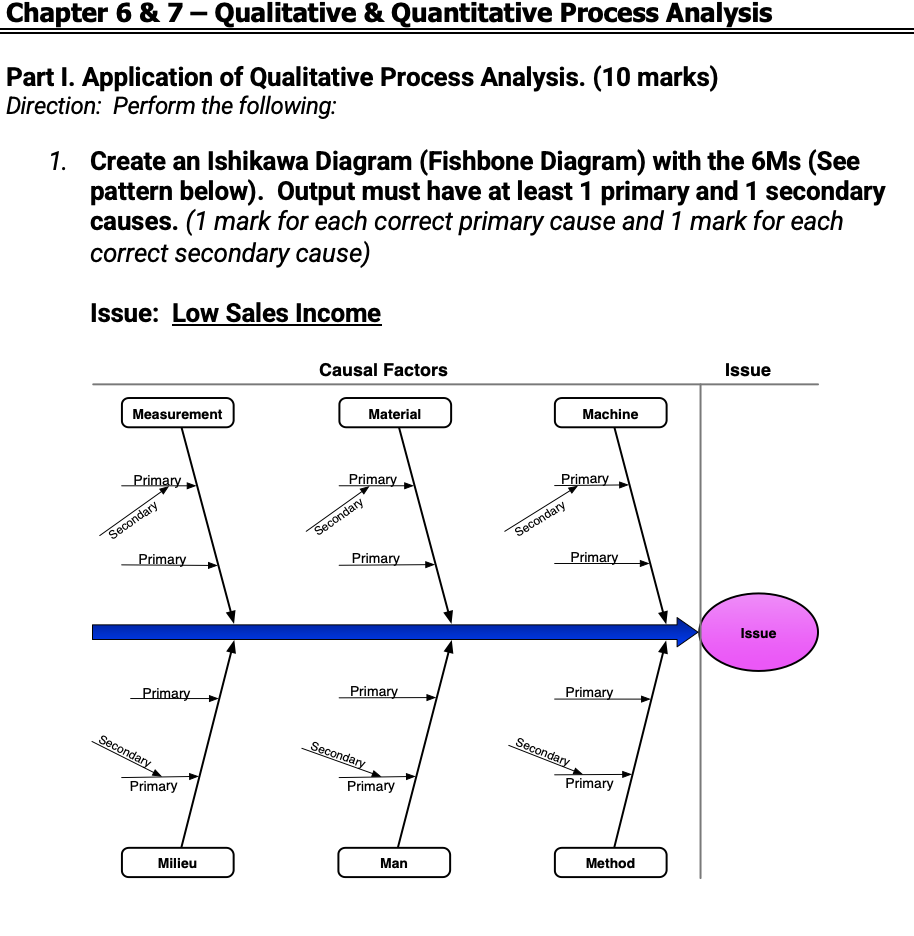
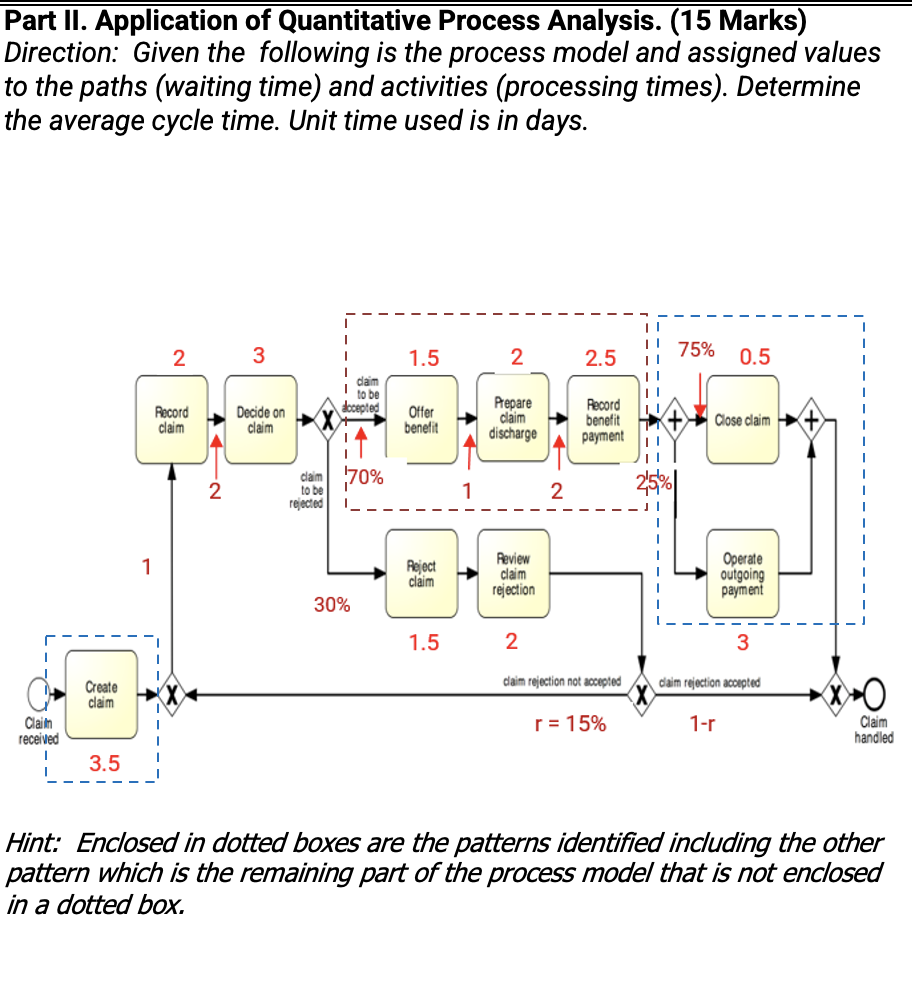
Please explain in detail Thank you art I. Application of Qualitative Process Analysis. (10 marks) irection: Perform the following: 1. Create an Ishikawa Diagram (Fishbone


Please explain in detail Thank you
art I. Application of Qualitative Process Analysis. (10 marks) irection: Perform the following: 1. Create an Ishikawa Diagram (Fishbone Diagram) with the 6Ms (See pattern below). Output must have at least 1 primary and 1 secondary causes. (1 mark for each correct primary cause and 1 mark for each correct secondary cause) Issue: Low Sales Income Part II. Application of Quantitative Process Analysis. (15 Marks) Direction: Given the following is the process model and assigned values to the paths (waiting time) and activities (processing times). Determine the average cycle time. Unit time used is in days. Hint: Enclosed in dotted boxes are the patterns identified including the other pattern which is the remaining part of the process model that is not enclosed in a dotted boxStep by Step Solution
There are 3 Steps involved in it
Step: 1

Get Instant Access to Expert-Tailored Solutions
See step-by-step solutions with expert insights and AI powered tools for academic success
Step: 2

Step: 3

Ace Your Homework with AI
Get the answers you need in no time with our AI-driven, step-by-step assistance
Get Started


