Answered step by step
Verified Expert Solution
Question
1 Approved Answer
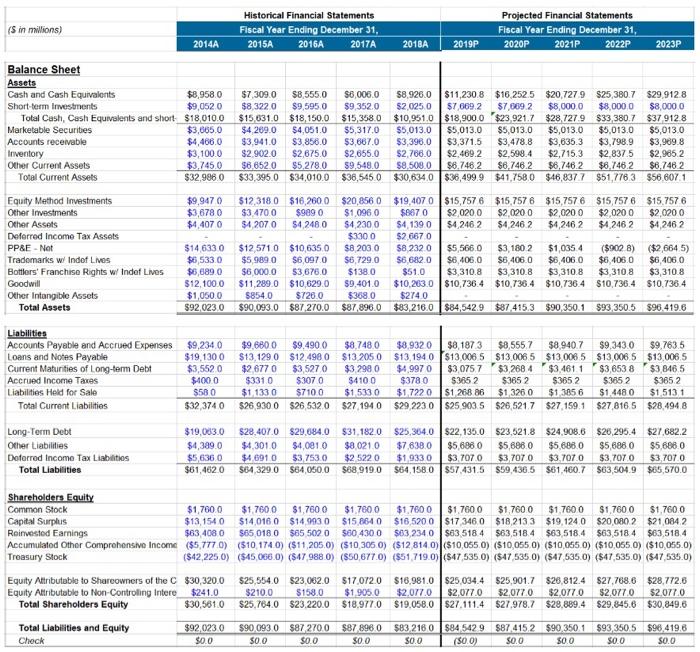
(S in millions) Balance Sheet 2014A Historical Financial Statements Fiscal Year Ending December 31, 2015A 2016A 2017A 2018A 2019P Projected Financial Statements Fiscal Year


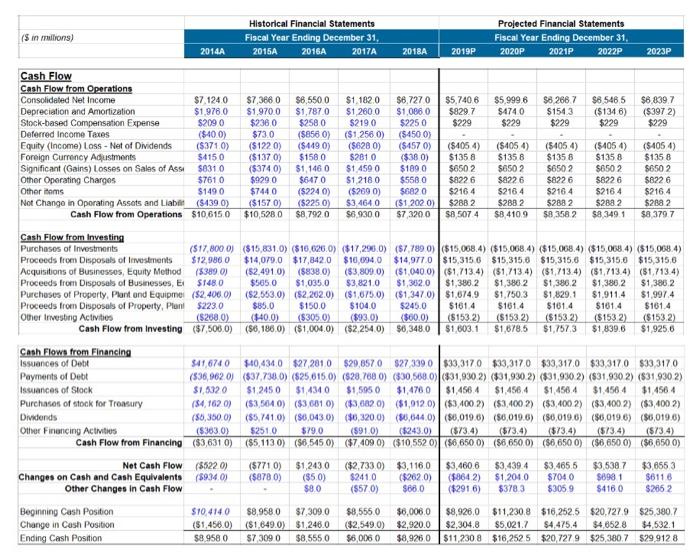
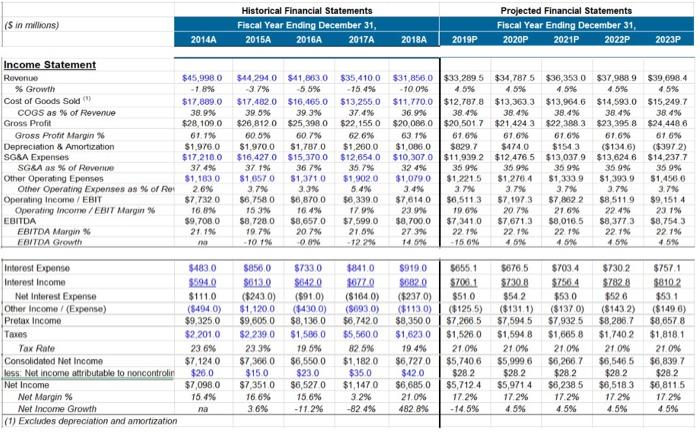
(S in millions) Balance Sheet 2014A Historical Financial Statements Fiscal Year Ending December 31, 2015A 2016A 2017A 2018A 2019P Projected Financial Statements Fiscal Year Ending December 31, 2020P 2021P 2022P 2023P Assets Cash and Cash Equivalents Short-term Investments Marketable Securites Accounts receivable Inventory Other Current Assets Total Current Assets Equity Method Investments Other Investments Other Assets $8,958.0 $7,309.0 $8,555.0 $6,006.0 $8,926.0 $11,230.8 $16,252.5 $20,727.9 $25,380.7 $29,912.8 $9,052.0 $8,322.0 $9,595.0 $9,352.0 $2,025.0 $7,669.2 $7,669.2 $8,000.0 $8,000.0 $8,000.0 Total Cash, Cash Equivalents and short $18,010.0 $15,631.0 $18,150.0 $15,358.0 $10,951.0 $18,900.0 $23,921.7 $28,727.9 $33,380.7 $37,912.8 $3,665.0 $4,269.0 $4.051.0 $5,317.0 $5,013.0 $5,013.0 $5,013.0 $5,013.0 $5,013.0 $5,013.0 $4,466.0 $3.941.0 $3,856.0 $3,667.0 $3,396.0 $3,371.5 $3,478.8 $3,635.3 $3,798.9 $3,969.8 $3,100.0 $2.902.0 $2,675.0 $2,655.0 $2,766.0 $2,469.2 $2,598.4 $2,715.3 $2.837.5 $2,965.2 $3,745.0 $6,652.0 $5,278.0 $9,548.0 $8,508.0 $6,746,2 $6,746.2 $6,746.2 $6,746.2 $6,746.2 $32,986.0 $33,395.0 $34,010.0 $36,545.0 $30,634.0 $36,499.9 $41,758.0 $46,837.7 $51,776.3 $56.607.1 $9,947.0 $12,318.0 $16,260.0 $20,856 0 $19,407 0 $15,757.6 $15,757 6 $15,757 6 $15,757 6 $15.757 6 $3,678.0 $4,407 0 $3,470.0 $4,207.0 $989 0 $4,248.0 $1,096.0 $867 0 $2,020.0 $2,020 0 $2,020.0 $2,020 0 $2,020 0 $4,2300 $4,139.0 $4,246.2 $4,246.2 $4,246.2 $4,246.2 $4,246.2 Deferred Income Tax Assets $330.0 $2,667.0 - PP&E-Not $14,633 0 Trademarks w/ Indof Lives $6,533.0 Bottlers' Franchise Rights w/ Indef Lives $6,689.0 Goodwill Other Intangible Assets Total Assets $12,100.0 $1,050.0 $92,023.0 $12,571.0 $10,635.0 $8,203.0 $8,232.0 $5,566.0 $3,180.2 $1,035.4 ($902.8) $5,989.0 $6,097.0 $6,729.0 $6,682.0 $6,406.0 $6,406.0 $6,406.0 $6,406.0 $6,406.0 $6,000.0 $3,676.0 $138.0 $51.0 $3,310.8 $3,310.8 $3,310.8 $3,310.8 $3,310.8 $11,289.0 $10,629.0 $9,401.0 $10,263.0 $10,736.4 $10,736.4 $10,736.4 $10,736.4 $10,736.4 $854.0 $726.0 $368.0 $274.0 $90,093.0 $87,270.0 $87,896.0 $83,216.0 $84,542.9 $87,415.3 $90,350.1 $93,350.5 $96.419.6 ($2,664.5) Liabilities Accounts Payable and Accrued Expenses $9,234.0 $9,660 0 $9,490.0 Loans and Notes Payable $19,130 0 $13,129.0 $12,498 0 $8,748.0 $13,205.0 $8,932.0 $8,187.3 $8,555.7 $8,940.7 $9,343.0 $9,763.5 $13,194 0 $13,006.5 $13.006.5 $13,006.5 $13,006.5 $13,006.5 Current Maturities of Long-term Debt $3,552.0 $2,677 0 $3,527 0 $3,298 0 $4,997 0 $3,075.7 Accrued Income Taxes $400.0 $331.0 $307.0 $4100 $378.0 Liabilities Held for Sale Total Current Liabilities $58.0 $32,374.0 $1,133 0 $710.0 $1,533 0 $1,722 0 $365.2 $1,268 86 $26,930 0 $26,532.0 $27,194.0 $29,223.0 $25,903.5 $3,268 4 $365 2 $1,326.0 $26,521.7 $3,461.1 $3,653 8 $3,846.5 $365.2 $365.2 $365.2 $1,385 6 $27,159.1 $1,448.0 $1,513.1 $27,816.5 $28,494.8 Long-Term Debt Other Liabilities Deferred Income Tax Liabilities Total Liabilities $19,063.0 $28,407.0 $29,684.0 $4,389.0 $4,301.0 $4,081.0 $5,636.0 $4.691.0 $3,753.0 $61,462.0 $64,329.0 $64,050.0 $31,182.0 $8,021.0 $2,522 0 $68,919.0 $25,364.0 $22,135.0 $23,521.8 $24,908.6 $26,295.4 $27,682.2 $7,638.0 $5,686.0 $5,686.0 $5,686.0 $5,686.0 $5,688.0 $1,933.0 $3,707.0 $3,707.0 $3,707.0 $3,707.0 $3,707.0 $64,158.0 $57.431.5 $59,436.5 $61,460.7 $63,504.9 $65,570.0 Shareholders Equity Common Stock Capital Surplus Reinvested Earnings $1,760.0 $13,154 0 $63,408.0 $1,760.0 $1,760 0 $14,016.0 $14.993.0 $65,018.0 $65,502.0 $1,760.0 $15,864 0 $60,430 0 $1,760 0 $16,520.0 $1,760 0 $1,760.0 $1,760.0 $1,760.0 $1,760.0 $17,346.0 $18,213.3 $19,124.0 $20,080.2 $21,084.2 $63,234.0 $63,518.4 $63,518.4 $63,518.4 $63,518.4 $63,518.4 Accumulated Other Comprehensive Income ($5,777.0) ($10,174.0) ($11,205.0) ($10,305.0) ($12,814.0) ($10,055.0) ($10,055.0) ($10,055.0) ($10,055.0) ($10,055.0) Treasury Stock ($42,225.0) ($45,066.0) ($47,988.0) ($50,677.0) ($51,719.0) ($47,535.0) ($47,535.0) ($47,535.0) ($47,535.0) ($47,535.0) Equity Attributable to Shareowners of the C Equity Attributable to Non-Controlling Intere Total Shareholders Equity $30,320.0 $241.0 $30,561.0 $25,554.0 $23,062.0 $17.072.0 $16,981.0 $25,034.4 $25,901.7 $26,812.4 $27,768.6 $28,772.6 $210.0 $158.0 $1,905.0 $2,077.0 $2,077.0 $2,077.0 $2.077.0 $2.077.0 $2,077.0 $25,764.0 $23,220.0 $18,977.0 $19,058.0 $27.111.4 $27.978.7 $28,889.4 $29.845.6 $30,849.6 Total Liabilities and Equity Check $92,023.0 $90,093.0 $87,270.0 $0.0 $0.0 $0.0 $87,896 0 $0.0 $83,216 0 $84,542 9 $87,415.2 $90,350.1 $93,350.5 $96,419.6 $0.0 ($0.0) $0.0 $0.0 $0.0 $0.0 ($in millions) Cash Flow Cash Flow from Operations 2014A Historical Financial Statements Fiscal Year Ending December 31, 2015A 2016A 2017A Projected Financial Statements 2018A 2019P 2021P Fiscal Year Ending December 31, 2020P 2022P 2023P Consolidated Net Income $7.124.0 $7,366.0 Depreciation and Amortization $1,976.0 $1.970.0 $6,550.0 $1.182.0 $6,727.0 $1,787.0 $1,260.0 $1,086.0 Stock-based Compensation Expense $209 0 $236.0 $258.0 $219.0 $225 0 $5,740.6 $829.7 $229 $5,999.6 $6,266.7 $474.0 $229 $6,546.5 $6,839.7 $154.3 ($134.6) ($397 2) $229 $229 $229 Deferred Income Taxes ($400) $73.0 ($856 0) ($1,256.0) ($450 0) Equity (Income) Loss - Net of Dividends ($371.0) ($122 0) ($449 0) ($628 0) ($457 0) ($405 4) ($405.4) ($405 4) ($4054) Foreign Currency Adjustments $415.0 ($137.0) $158 0 $281 0 ($38.0) $135.8 $135.8 $135.8 $135.8 ($4054) $135 8 Significant (Gains) Losses on Sales of Assi $831.0 ($374 0) $1,146 0 $1,459 0 $189.0 $650.2 $650 2 $650 2 $650 2 $650.2 Other Operating Charges $761 0 $929.0 $647.0 $1,218 0 $558.0 $8226 $822 6 $8226 $822 6 $822 6 Other items $149 0 $744.0 ($224 0) ($269 0) $682 0 $216 4 $216.4 $216.4 $216.4 $216.4 Not Change in Operating Assots and Liab Cash Flow from Operations ($439.0) ($157.0) ($225.0) $3.464.0 ($1,202.0) $288 2 $288.2 $288 2 $288.2 $288 2 $10,615.0 $10,528.0 $8,792.0 $6,930.0 $7,320 0 $8,507 4 $8,410.9 $8,358.2 $8,349.1 $8,379.7 Cash Flow from Investing Purchases of Investments Proceeds from Disposals of Investments Acquisitions of Businesses, Equity Method Proceeds from Disposals of Businesses, Er Purchases of Property, Plant and Equipme Proceeds from Disposals of Property, Plan! Other Investing Activities ($17,800.0) ($15,831.0) ($16,626.0) ($17,296.0) ($7,789 0) ($15,068.4) ($15,068.4) ($15,068.4) ($15,068.4) ($15,068.4) $12,986 0 $14,079.0 $17,842.0 $16,094.0 $14,977.0 $15,315.6 $15,315.6 $15,315.6 $15,315.0 $15,315.6 ($389.0) ($2,491.0) ($838.0) ($3,809.0) ($1,040.0) ($1,713.4) ($1,713.4) ($1,713.4) ($1,713.4) ($1,713.4) $148.0 $565.0 $1,035.0 $3,821.0 $1,362.0 $1,386.2 $1,386.2 $1,386.2 $1,386.2 $1,386.2 ($2,406.0) ($2.553.0) ($2.262.0) ($1,675.0) ($1,347.0) $1,674.9 $1,750.3 $1,829.1 $1,911.4 $1,997.4 $223.0 $85.0 $150.0 $104.0 $245.0 $161.4 $161.4 $161.4 ($268.0) ($40.0) ($305.0) ($93.0) ($60.0) ($153.2) ($153.2) ($153.2) Cash Flow from Investing ($7,506.0) ($6,186.0) ($1,004.0) ($2,254.0) $6,348.0 $1,603.1 $1,678.5 $161.4 $161.4 ($153 2) ($153.2) $1,757.3 $1,839.6 $1,925.6 Cash Flows from Financing Issuances of Debt Payments of Debt Issuances of Stock Purchases of stock for Treasury Dividends Other Financing Activities ($363.0) Cash Flow from Financing ($3,631 0) $41,674 0 $40,434.0 $27,281.0 $29,857.0 $27,339.0 $33,317.0 $33,317.0 $33,317.0 $33,317.0 $33,317.0 ($36,962.0) ($37,738.0) ($25,615.0) ($28,768 0) ($30,568.0) ($31,930.2) ($31,930.2) ($31,930.2) ($31,930.2) ($31,930.2) $1,532 0 $1,245 0 $1,434 0 $1,595 0 $1,476.0 $1,456.4 $1,456.4 $1,456.4 $1,456 4 $1,456 4 ($4,162 0) ($3,564.0) ($3,681.0) ($3,682.0) ($1,912.0) ($3,400.2) ($3,400 2) ($3,400.2) ($3,400.2) ($3,400.2) ($5,350.0) ($5,741.0) ($6,043.0) ($6,320.0) ($6,644.0) ($6,019.6) ($6,019.6) ($6,019.6) ($6,019.6) ($6,019.6) $251.0 $79.0 ($91.0) ($243.0) ($73.4) ($73.4) ($5,1130) ($6,545.0) ($7,409.0) ($10,552 0) ($6,650.0) ($6,650.0) ($73.4) ($6,650 0) ($73.4) (573.4) ($6,650.0) ($6,650.0) Net Cash Flow Changes on Cash and Cash Equivalents ($522 0) (5934.0) ($771 0) ($878.0) Other Changes in Cash Flow $1,243.0 ($50) $8.0 ($2,733.0) $3,116.0 $3,460.6 $3,439.4 $241.0 ($262.0) ($864.2) $1,204.0 ($57.0) $66.0 ($2916) $378.3 $3,465.5 $3,538 7 $3,655.3 $704.0 $305.9 $698 1 $611.6 $416.0 $266.2 Beginning Cash Position Change in Cash Position $10,414.0 ($1,456.0) $8.958.0 Ending Cash Position $8.958 0 ($1,649.0) $7,309 0 $7,309.0 $1,246.0 $8,555.0 $8,555.0 $6,006.0 ($2,549.0) $2,920.0 $6,006 0 $8.926.0 $8,926.0 $11,230.8 $16,252.5 $20,727.9 $25,380.7 $2,304.8 $5,021.7 $4,475.4 $4,652.8 $4,532.1 $11,230.8 $16,252.5 $20,727 9 $25,380.7 $29.912 8 Historical Financial Statements (S in millions) 2014A Fiscal Year Ending December 31, 2015A 2016A 2017A 2018A 2019P Projected Financial Statements Fiscal Year Ending December 31, 2020P 2021P 2022P 2023P Income Statement Revenue % Growth Cost of Goods Sold (!) COGS as % of Revenue Gross Profit $28,109.0 Gross Profit Margin % Depreciation & Amortization SG&A Expenses SG&A as % of Revenue Other Operating Epenses $1,183.0 Other Operating Expenses as % of Re 2.6% Operating Income/EBIT $7,732 0 Operating Income/EBIT Margin % 16.8% EBITDA $9,700.0 EBITDA Margin % 21.1% EBITDA Growth na $45,998.0 $44,294.0 $41,863.0 -1.8% -3.7% -5.5% $17,809.0 $17,482.0 $16,465.0 38.9% 39.5% 39.3% $26,812 0 $25,398.0 61.1% 60.5% 60.7% $1,976.0 $1,970.0 $1,787.0 $17,218.0 $16,427.0 $15,370.0 37.4% 37.1% 36.7% $1,657.0 $1,371.0 3.7% 3.3% $6,758.0 $6,870.0 15.3% 16.4% $8,728.0 $8,657.0 19.7% 20.7% -10 1% $35,410.0 $31,856.0 $33,289.5 $34,787.5 $36,353.0 $37,988.9 $39,698.4 -15.4% -100% 4.5% $13,255.0 $11,770.0 $12,787.8 37.4% 36.9% 38.4% $22,155.0 $20,088.0 $20,501.7 62.6% 63.1% 61.6% $1,260.0 $1,086.0 $829.7 $12,654.0 $10,307.0 $11,939.2 35.7% 32.4% 35.9% $1,902.0 $1,079.0 $1,221.5 5.4% 3.4% 3.7% $6,339.0 $7,614.0 $6,511.3 17.9% 23.9% 19.6% $7,599.0 $8,700.0 $7,341.0 4.5% 21.6% $8,016.5 4.5% 4.5% 4.5% $13,363.3 $13,964.6 $14,593.0 $15,249.7 38.4% 38.4% 38.4% 38.4% $21,424.3 $22,388.3 $23,395.8 $24,448.6 61.6% 61.6% 61.6% $474.0 $154.3 ($134.6) $12,476.5 $13,037.9 $13,624.6 35.9% 35.9% 35.9% $1,276.4 $1,333.9 3.7% 3.7% $7,197.3 $7,862 2 20.7% $7,671.3 61.6% ($397.2) $14,237.7 $1,393.9 3.7% 35.9% $1,456.6 3.7% $8,511.9 $9,151 4 22.4% 23.1% $8,377.3 $8,754.3 21.5% 27.3% 22.1% 22.1% 22.1% 22.1% 22.1% -0.8% -12 2% 14.5% -15 6% 4.5% 4.5% 4.5% 4.5% Interest Expense $483.0 $856.0 $733.0 $841.0 $919.0 $655.1 $676.5 $703.4 $730.2 $757.1 Interest Income $594.0 $613.0 $642.0 $677.0 $682.0 Net Interest Expense $111.0 ($243.0) ($91.0) ($164.0) ($237.0) Other Income/ (Expense) ($494.0) $1,120.0 ($430.0) ($693.0) ($113.0) Pretax Income $9,325.0 $9,605.0 $8,136 0 $6,742.0 $8,350 0 Taxes $2,201.0 $2,239.0 $1,586.0 $5,560.0 $1,623.0 Tax Rate 23.6% 23.3% 19.5% 82.5% 19.4% Consolidated Net Income $7,124.0 less: Net income attributable to noncontrolin Net Income Net Margin % Net Income Growth $7,366.0 $26.0 $15.0 $7,098.0 $7,351.0 15.4% 16.6% 3.6% $6,550.0 $23.0 $6,527.0 15.6% -11.2% $1,182.0 $35.0 $1,147.0 3.2% -82.4% 17.2% 17.2% -14.5% 4.5% $706.1 $730.8 $756.4 $51.01 $54.2 $53.0 ($125.5) ($131.1) ($137.0) ($143.2) ($149.6) $7,266.5 $7,594.5 $7,932.5 $8,286.7 $8,657.8 $1,526.0 $1,594.8 $1,665.8 $1,740.2 $1,818.1 21.0% 21.0% 21.0% 21.0% 21.0% $6,727.0 $5,740.6 $5,999.6 $6,266.7 $6,546.5 $6,839.7 $42.0 $28.2 $28.2 $28.2 $28.2 $6,685.0 $5,712.4 $5,971.4 $6,238.5 $6,518.3 $6,811.5 21.0% 482.8% $782.8 $810.2 $52.6 $53.1 $28.2 17.2% 4.5% 17.2% 4.5% 17.2% 4.5% (1) Excludes depreciation and amortization
Step by Step Solution
There are 3 Steps involved in it
Step: 1
Okay lets work through this stepbystep Assumptions Revenue Growth XYZ Tech Provide the revenue growth rate assumptions for each year Operating Margin Industry Provide the operating margin assumptions ...
Get Instant Access to Expert-Tailored Solutions
See step-by-step solutions with expert insights and AI powered tools for academic success
Step: 2

Step: 3

Ace Your Homework with AI
Get the answers you need in no time with our AI-driven, step-by-step assistance
Get Started


