

Question: PLEASE HELP ASAP Here's the code I have so far (nothing is appearing on the graph - PLEASE HELP ASAP: a) clc clear figure gamma
PLEASE HELP ASAP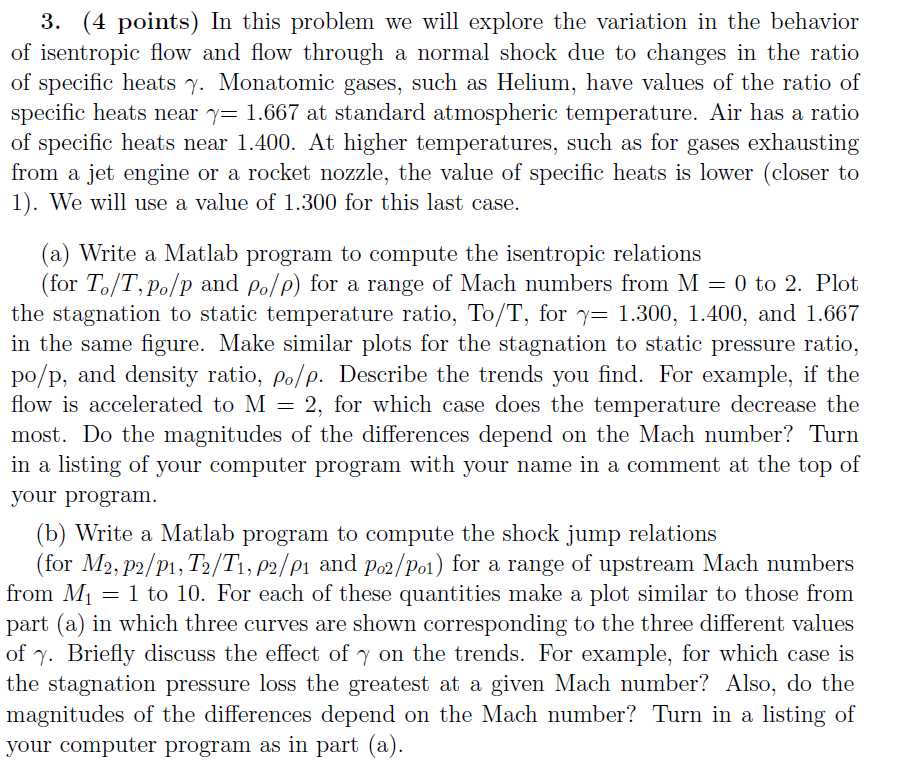
Here's the code I have so far (nothing is appearing on the graph - PLEASE HELP ASAP:
a)
clc clear figure
gamma = [1.3 1.4 1.667]; M = (0:0.2:2);
for k = 1:length(M) for p=1:length(gamma) hold on
STRatio = (1+((gamma(p)-1)/2)*(M(k)^2)); SPRatio= (1+((gamma(k)-1)/2)*(M(k)^2))^(gamma(k)/(gamma(k)-1)); SRHORatio= (1+((gamma(k)-1)/2)*(M(k)^2))^(1/(gamma(k)-1)); plot(M(k),STRatio(k),'DisplayName','T_{0}/T');
hold on plot(M(k),SPRatio,'--','DisplayName','P_{0}/P');
plot(M(k),SRHORatio,'o','DisplayName','rho_{0}/rho');
legend('show'); title('Variation of Isentropic Properties as a function of different Mach numbers and specific ratios'); xlabel('Mach Number'); ylabel('T_{0}/T,P_{0}/P, and rho_{0}/rho'); xlim([0 2]) ylim([0 3]) grid on hold off
end end
b)
clc clear figure
gamma = [1.3 1.4 1.667]; M = (0:10);
for k = 1:length(M) for p=1:length(gamma) hold on TRatio= (1+((2*gamma(p))/(gamma(p)+1)*((M(k)^2)-1)))*((2+(gamma(p)-1)*(M(k)^2))/(gamma(p)+1)*(M(k)^2))
% SPRatio= (1+((gamma(k)-1)/2)*(M(k)^2))^(gamma(k)/(gamma(k)-1)); % SRHORatio= (1+((gamma(k)-1)/2)*(M(k)^2))^(1/(gamma(k)-1)); plot(M(k),TRatio,'DisplayName','T_{2}/T_{1}');
% hold on % plot(M(k),SPRatio,'--','DisplayName','P_{0}/P'); % % % plot(M(k),SRHORatio,'o','DisplayName','rho_{0}/rho');
legend('show'); title('Variation of Isentropic Properties as a function of different Mach numbers and specific ratios'); xlabel('Mach Number'); ylabel('T_{2}/T_{1},P_{0}/P, and rho_{0}/rho'); xlim([0 10]) grid on hold off
end end % end
3. (4 points) In this problem we will explore the variation in the behavior of isentropic flow and flow through a normal shock due to changes in the ratio of specific heats . Monatomic gases, such as Helium, have values of the ratio of specific heats near = 1.667 at standard atmospheric temperature. Air has a ratio of specific heats near 1.400. At higher temperatures, such as for gases exhausting from a jet engine or a rocket nozzle, the value of specific heats is lower (closer to 1). We will use a value of 1.300 for this last case (a) Write a Matlab program to compute the isentropic relations (for T.T.Po/p and /P) for a range of Mach numbers from M-0 to 2. Plot the stagnation to static temperature ratio. To/T, for = 1.300. 1.400, and 1.667 in the same figure. Make similar plots for the stagnation to static pressure ratio, po/p, and density ratio, po/ p. Describe the trends you find. For example, if the flow is accelerated to M-2, for which case does the temperature decrease the most. Do the magnitudes of the differences depend on the Mach number? Turn in a listing of your computer program with your name in a comment at the top of your program (b) Write a Matlab program to compute the shock jump relations (for M2,P2/P1, T2/T, 2/P1 and Po2/01) for a range of upstream Mach numbers from Mi -1 to 10. For each of these quantities make a plot similar to those from part (a) in which three curves are shown corresponding to the three different values of . Briefly discuss the effect of on the trends. For example, for which case is the stagnation pressure loss the greatest at a given Mach number? Also, do the magnitudes of the differences depend on the Mach number? Turn in a listing of your computer program as in part (a) 3. (4 points) In this problem we will explore the variation in the behavior of isentropic flow and flow through a normal shock due to changes in the ratio of specific heats . Monatomic gases, such as Helium, have values of the ratio of specific heats near = 1.667 at standard atmospheric temperature. Air has a ratio of specific heats near 1.400. At higher temperatures, such as for gases exhausting from a jet engine or a rocket nozzle, the value of specific heats is lower (closer to 1). We will use a value of 1.300 for this last case (a) Write a Matlab program to compute the isentropic relations (for T.T.Po/p and /P) for a range of Mach numbers from M-0 to 2. Plot the stagnation to static temperature ratio. To/T, for = 1.300. 1.400, and 1.667 in the same figure. Make similar plots for the stagnation to static pressure ratio, po/p, and density ratio, po/ p. Describe the trends you find. For example, if the flow is accelerated to M-2, for which case does the temperature decrease the most. Do the magnitudes of the differences depend on the Mach number? Turn in a listing of your computer program with your name in a comment at the top of your program (b) Write a Matlab program to compute the shock jump relations (for M2,P2/P1, T2/T, 2/P1 and Po2/01) for a range of upstream Mach numbers from Mi -1 to 10. For each of these quantities make a plot similar to those from part (a) in which three curves are shown corresponding to the three different values of . Briefly discuss the effect of on the trends. For example, for which case is the stagnation pressure loss the greatest at a given Mach number? Also, do the magnitudes of the differences depend on the Mach number? Turn in a listing of your computer program as in part (a)
Step by Step Solution
There are 3 Steps involved in it

Get step-by-step solutions from verified subject matter experts