Answered step by step
Verified Expert Solution
Link Copied!

Question

1 Approved Answer

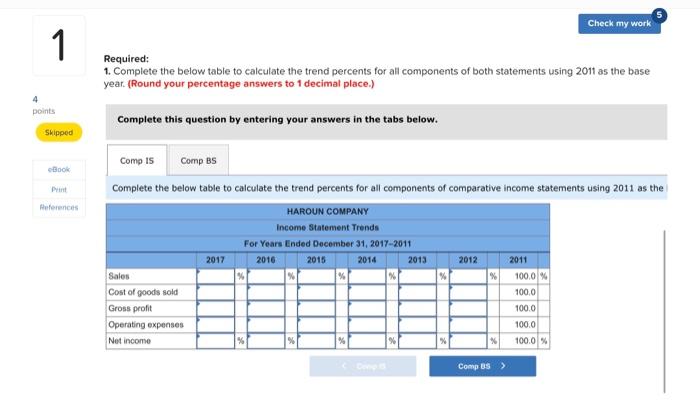
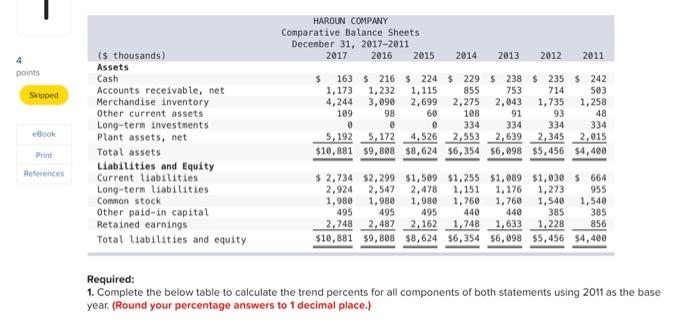
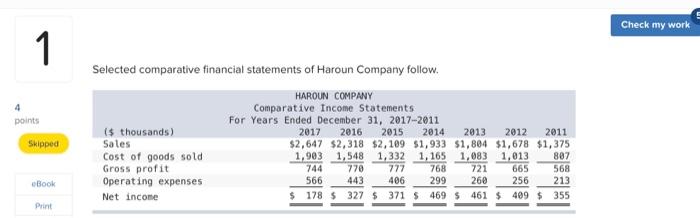
please help me out soon as possible thank u 1 Complete the below table to calculate the trend percents for all components of comparative balance

please help me out soon as possible thank u image text in transcribed
image text in transcribed
1 Complete the below table to calculate the trend percents for all components of comparative balance sheets using 2011 as the base HAROUN COMPANY Balance Sheet Trends December 31, 2017-2011 2016 2015 2014 4 points 2017 2013 2012 2011 Skipped % % eBook Print 100.0 % 100.0 100.0 100.0 100.0 100.0 References Assets Cash Accounts receivable.net Merchandise inventory Other current assets Long-term investments Plant assets, net Total assets Liabilities and Equity Current liabilities Long-term liabilities Common stock Other pald-in capital Retained earnings Total liabilities & equity % 100.0 % % 100.0 % 100.0 100.0 100.0 100.0 % 100.0 HAROUN COMPANY Comparative Balance Sheets December 31, 2017-2011 2017 2016 2015 2014 2013 2012 2011 4 points Skipped is thousands) Assets Cash Accounts receivable, net Merchandise inventory Other current assets Long-term investments Plant assets, net Total assets Liabilities and Equity Current liabilities Long-term liabilities Common stock Other paid-in capital Retained earnings Total liabilities and equity $ 163 $ 216 $ 224 $ 229 $ 238 $ 235 $ 242 1.173 1,232 1,115 855 753 714 503 4,244 3,090 2,699 2,275 2,043 1,735 1,258 109 98 60 108 91 93 48 0 334 334 334 334 5,192 5,172 4,526 2,553 2,639 2,345 2,015 $10,881 $9,898 $8,624 $6,354 $6,098 $5,456 $4,400 Book Print References $ 2,734 $2,299 $1,509 $1,255 $1,089 $1,030 664 2,924 2,547 2,478 1,151 1,176 1,273 955 1,980 1,980 1,980 1,760 1,760 1,540 1,540 495 495 495 440 385 385 2,748 2,487 2,162 1,748 1,633 1,228 856 $10,881 $9,808 $8,624 $6,354 $6,098 $5,456 $4,400 440 Required: 1. Complete the below table to calculate the trend percents for all components of both statements using 2011 as the base year. (Round your percentage answers to 1 decimal place.) Check my work 1 4 points Selected comparative financial statements of Haroun Company follow. HAROUN COMPANY Comparative Income Statements For Years Ended December 31, 2017-2011 (s thousands) 2017 2016 2015 2014 2013 2012 2011 Sales $2,647 $2,318 $2,109 $1,933 $1,804 $1,678 $1,375 Cost of goods sold 1,903 1,548 1,332 1,165 1,083 1,013 807 Gross profit 744 770 777 768 721 665 568 Operating expenses 566 443 406 299 260 256 213 Net income $ 178 $ 327 $ 371 $ 469 $ 461 $ 499 $ 355 Skipped Book Print

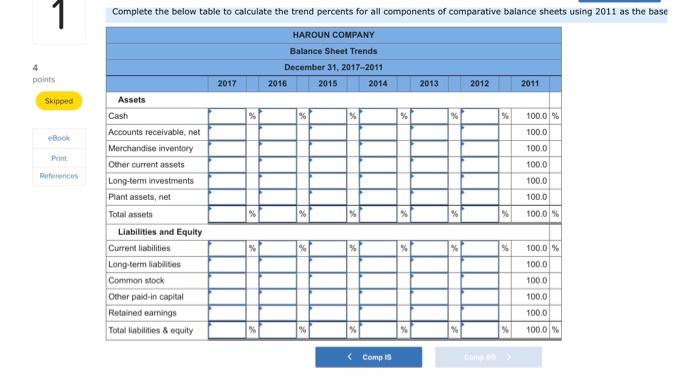
Step by Step Solution

There are 3 Steps involved in it

Step: 1

blur-text-image

Get Instant Access to Expert-Tailored Solutions

See step-by-step solutions with expert insights and AI powered tools for academic success

Step: 2

blur-text-image

Step: 3

blur-text-image

Ace Your Homework with AI

Get the answers you need in no time with our AI-driven, step-by-step assistance

Get Started

Recommended Textbook for

Government Contracts Audits And Compliance

Authors: Gregory A. Garrett

1st Edition

0808023926, 978-0808023920

More Books

Students also viewed these Accounting questions