Question: please, put the exhibits into excel and show the work put into excel thats needed to answers questions 1 - 6. INTRODUCTION Allegheny County Port
please, put the "exhibits" into excel and show the work put into excel thats needed to answers questions 1 - 6.
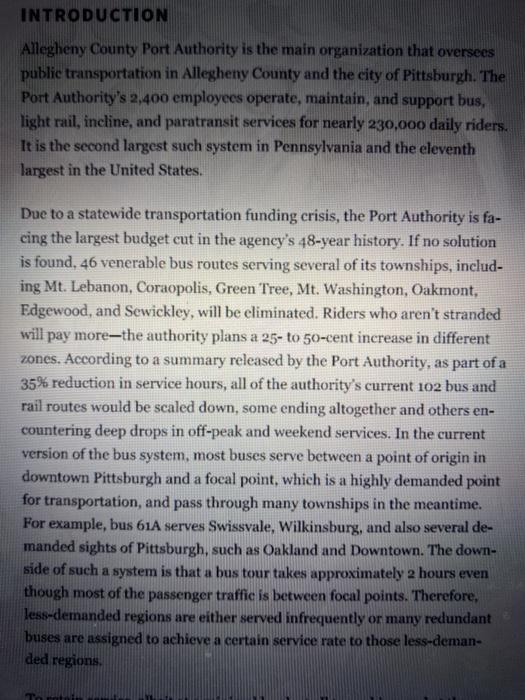
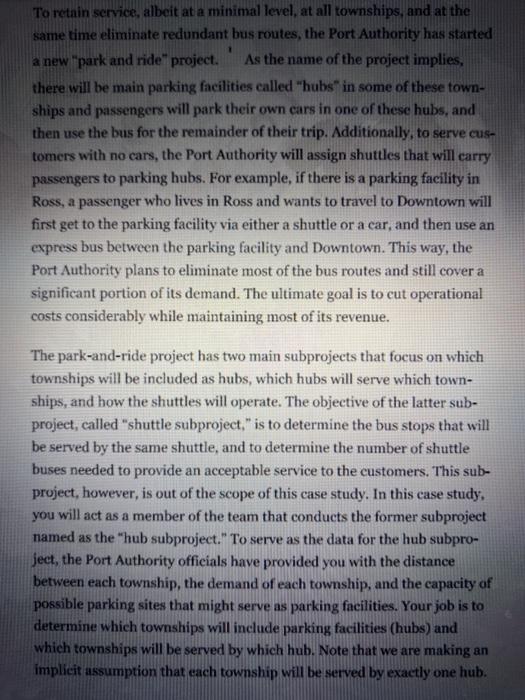
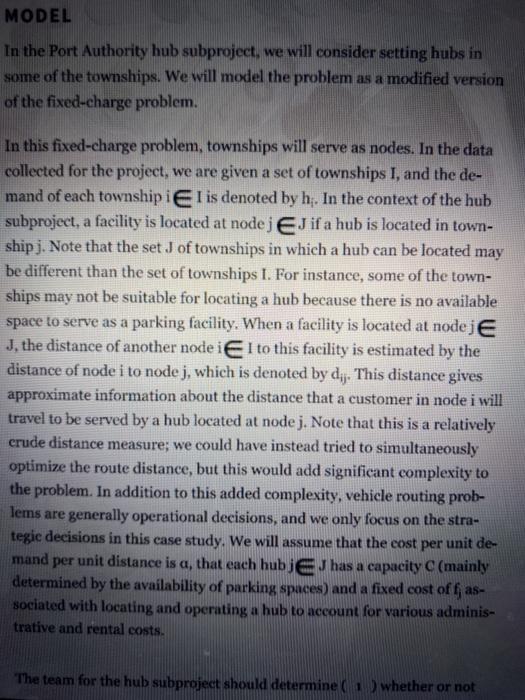
INTRODUCTION Allegheny County Port Authority is the main organization that oversees public transportation in Allegheny County and the city of Pittsburgh. The Port Authority's 2,400 employees operate, maintain, and support bus, light rail, incline, and paratransit services for nearly 230,000 daily riders. It is the second largest such system in Pennsylvania and the eleventh largest in the United States. Due to a statewide transportation funding crisis, the Port Authority is fa- cing the largest budget cut in the agency's 48-year history. If no solution is found, 46 venerable bus routes serving several of its townships, includ- ing Mt. Lebanon, Coraopolis, Green Tree, Mt. Washington, Oakmont, Edgewood, and Sewickley, will be eliminated. Riders who aren't stranded will pay more-the authority plans a 25- to 50-cent increase in different zones. According to a summary released by the Port Authority, as part of a 35% reduction in service hours, all of the authority's current 102 bus and rail routes would be scaled down, some ending altogether and others en- countering deep drops in off-peak and weekend services. In the current version of the bus system, most buses serve between a point of origin in downtown Pittsburgh and a focal point, which is a highly demanded point for transportation, and pass through many townships in the meantime. For example, bus 61A serves Swissvale, Wilkinsburg, and also several de manded sights of Pittsburgh, such as Oakland and Downtown. The down- side of such a system is that a bus tour takes approximately 2 hours even though most of the passenger traffic is between focal points. Therefore, less-demanded regions are either served infrequently or many redundant buses are assigned to achieve a certain service rate to those less-deman- ded regions. Toto 1 To retain service, albeit at a minimal level, at all townships, and at the same time eliminate redundant bus routes, the Port Authority has started a new "park and ride" project. As the name of the project implies, there will be main parking facilities called "hubs in some of these town- ships and passengers will park their own cars in one of these hubs, and then use the bus for the remainder of their trip. Additionally, to serve cus- tomers with no cars, the Port Authority will assign shuttles that will carry passengers to parking hubs. For example, if there is a parking facility in Ross, a passenger who lives in Ross and wants to travel to Downtown will first get to the parking facility via either a shuttle or a car, and then use an express bus between the parking facility and Downtown. This way, the Port Authority plans to eliminate most of the bus routes and still cover a significant portion of its demand. The ultimate goal is to cut operational costs considerably while maintaining most of its revenue. The park-and-ride project has two main subprojects that focus on which townships will be included as hubs, which hubs will serve which town- ships, and how the shuttles will operate. The objective of the latter sub- project, called "shuttle subproject," is to determine the bus stops that will be served by the same shuttle, and to determine the number of shuttle buses needed to provide an acceptable service to the customers. This sub- project, however, is out of the scope of this case study. In this case study, you will act as a member of the team that conducts the former subproject named as the "hub subproject. To serve as the data for the hub subpro- ject, the Port Authority officials have provided you with the distance between each township, the demand of each township, and the capacity of possible parking sites that might serve as parking facilities. Your job is to determine which townships will include parking facilities (hubs) and which townships will be served by which hub. Note that we are making an implicit assumption that each township will be served by exactly one hub. PRE-ANALYSIS Before starting the model section, answer the following questions: 1. Location problems are frequently used in practice. Find two real-life ex- amples from newspapers, blogs, or journals within the last five years, in which benefits and/or failure of location (factory, warehouse, transporta- tion hub) decisions made by specific companies or government agencies are discussed. What are critical conclusions in these stories? 2. Explain the advantages of using hubs instead of serving between all possible origin-destination pairs. 3. In the current project structure, the Port Authority uses two subpro- jects to handle hub location and shuttle assignment problems. Thus, two independent optimization problems are solved to determine these de- cisions. What challenges have led to this solution approach? Would it be possible to find an alternative solution approach using the same available data? What would the challenges be of solving one optimization problem that determines everything? 4. To model the hub project, we will use a modified version of one of the facility location problems that you have likely seen before during your course of study. Which facility location problem would best fit the current problem given the data at hand? Explain why and how. Hint: Think of a hub as a facility that will be located and townships as nodes. MODEL MODEL In the Port Authority hub subproject, we will consider setting hubs in some of the townships. We will model the problem as a modified version of the fixed-charge problem. In this fixed-charge problem, townships will serve as nodes. In the data collected for the project, we are given a set of townships 1, and the de- mand of each township EI is denoted by h;. In the context of the hub subproject, a facility is located at nodej EJ if a hub is located in town- ship). Note that the set J of townships in which a hub can be located may be different than the set of townships I. For instance, some of the town- ships may not be suitable for locating a hub because there is no available space to serve as a parking facility. When a facility is located at nodeje J, the distance of another node i I to this facility is estimated by the distance of node i to nodej, which is denoted by dij. This distance gives approximate information about the distance that a customer in node i will travel to be served by a hub located at nodej. Note that this is a relatively crude distance measure; we could have instead tried to simultaneously optimize the route distance, but this would add significant complexity to the problem. In addition to this added complexity, vehicle routing prob- lems are generally operational decisions, and we only focus on the stra- tegie decisions in this case study. We will assume that the cost per unit de- mand per unit distance is a, that each hub jEJ has a capacity C (mainly determined by the availability of parking spaces) and a fixed cost off, as- sociated with locating and operating a hub to account for various adminis- trative and rental costs. The team for the hub subproject should determine whether or not The team for the hub subproject should determine ( 1 ) whether or not to place a facility at nodei EJ represented by the binary variable x and 2 ) whether a node i EI will be served at facility j, which is represented by the binary variable yy. The objective is to minimize total facility and transportation costs. Thus, the optimization problem for the Port Author- ity can be stated as follows: max fx, +hd,, , jej iel jej (1) jej s.t. Ey, = 1 for all ie I Y, S x, for all i e I, JEJ hy, sCx, for all je J (2) (3) fel (0,1} for allje J Y (0, 1) for all i e I, je J Constraint ensures that each township is served by exactly one hub. Constraint 2 states that a hub should be located at a site in order to be able to serve a township. Constraint 3 is the capacity constraint for each facility. Y; (0, 1) for all ie I,je J Constraint i ensures that each township is served by exactly one hub. Constraint 2 states that a hub should be located at a site in order to be able to serve a township. Constraint 3 is the capacity constraint for each facility DATA FOR CASE ANALYSIS In this case study, you are asked to focus on 15 distinct townships of Al- legheny County, specifically Baldwin, Hampton, Indiana, McCandless, O'Hara, Pine, North Fayette, Robinson, Ross, Shaler, South Park, Spring- dale, Upper St. Clair, South Fayette, and Marshall. Initial data analysis re- veals that these townships have medium propensity to use public trans- portation, which is sufficient to cover the fixed investments of the park- and-ride project, but insufficient to keep two-way public transportation routes. Furthermore, most of the residents of these townships have cars, and they have long commuting periods, which makes these townships ideal spots for park-and-ride facilities. You will consider each distinct township as a node. Due to the extreme cost of land and/or unavailability of the required parking space, Hamp- each township available for hub location are shown in Exhibit 15.1. As the table displays, the distances between two locations are not symmetric because the given distances represent actual road distances compiled as the shortest paths between the corresponding origin-destination pairs. Clearly, the demand behavior is quite dependent on the segment of the population, as well as the time of day considered that is, there are signi- ficant differences between regular hours versus rush (peak) hours. For the purposes of the park-and-ride project, we will focus on the rush hour be- havior of the working class. Most of the transportation occurs during this time as the target population in the park-and-ride project, the working class, gets to work and returns back home. While the contribution of occa- sional riders during day time is not negligible, the corresponding demand is very ad hoc in nature, and thus hard to model. On the other hand, we expect to see the same type of demand pattern (albeit in the opposite dir- ection) during both morning and evening rush hours for the working class; therefore, we will only focus on the evening rush hour (4:00 p.m.- 6:00 p.m. during weekdays) for this segment of the population. The es- timated average daily demand level during the evening rush hour at each node is shown in Exhibit 15.2. In the test phase of the park-and-ride project, the Port Authority has de- cided to acquire and maintain hubs of uniform size; that is, each hub can serve 200 people per day. In the later phases of the project, adjusting the capacity of each hub based on the demand level will be considered. Pre- liminary analysis also indicated that the total daily operational cost of a hub varies for each township depending on the rental rates of parking spaces, and the corresponding estimates are shown in Exhibit 15.3. Note that this cost includes the daily cost of maintaining hubs, the cost of oper- ating express buses, and daily wages of the drivers. It is also roughly es- timated that a hub has a transportation cost of $0.10 per passenger per STUDY QUESTIONS Your first and most important task is to develop and solve an appropriate facility location problem, described earlier in this chapter. You should ex- plicitly describe this main model and give the corresponding Excel spreadsheets. In addition to this, consider the following scenarios/conditions and ex- plain how the model should be modified to capture these scenarios/conditions (independent of each other for each of these ques- tions unless otherwise stated) and state the resulting optimal solution and optimal objective value in each of these cases. 1. The solution of the original model revealed that some passengers need to travel long distances to park their cars and use buses. To avoid such problems, the project team decided that the distance between a hub and a node (township) that is served by the hub cannot exceed 15 miles. 2. A hub cannot serve more than three nodes. 3. The townships of Hampton and Indiana should be served by the same hub. 4. The townships of South Park and Hampton cannot be served by the same hub. 5. Due to budgetary restrictions, in the test phase of this project, how would the solution change if you cannot locate more than three hubs? What is the opportunity cost of such a limitation; that is, how much more would you be willing to pay to be able to locate a fourth hub? What about for adding two more hubs? Determine explicitly your willingness to pay for adding two more hubs? Determine explicitly your willingness to pay for the fourth, fifth, ..., eleventh hub. Do you think that your willingness to pay for the additional number of hubs you can have is linearly dependent on the number of hubs you are already allowed to have? 6. What happens if the transportation cost per mile per passenger changes to $0.50? How does the solution change? Specifically, how many facilities are located before and after the change in transportation cost? Explain why such a change occurs. 7. Which facility location model would you use if there were no demand data present but only the condition given in question 1? Write and solve the corresponding updated integer programming model. 8. Consider an alternative scheme. It has been decided that exactly seven hubs will be opened. For purposes of fairness, every hub will receive the same daily budget. This budget is used both for operational costs of the hub and for transportation costs of townships served by the hub. Any part of the budget that is left over is considered to be lost. What is the smallest budget possible? Write and solve the corresponding updated integer pro- gramming model. 9. What modifications would you suggest to make this model more real- istic under the data restrictions explained before? What would be the cor- responding parameters needed and how can those be calculated? Is there a downside of making the model more realistic? ENDNOTE 1 All data, characters, and project names introduced throughout the case are fictional. First solve the facility location optimization model discussed in Section 3 of the case (in the current poject structure, the port authority uses two subprojects to handle hub location and shuttle assignment problems. Thus two independent optimization problems are solved to determine these decisions. What challenges have led to determine this solution approach? Would it be possible to find an alternative solution approach using the same available data? What would the challenges be of solving one optimization problem that determines everything? Then I would like you to modify your initial model to answer questions 1-6 in Section 42 of the case. Assume that each of these questions is independent from the others (ie, the analysis for question 1 does not affect that of question 2, the analysis for question 2 does not affect the analysis for question 3, and so on.). I would like you to make the following adjustments to several of the questions written in the case instead of analyzing what it written there: For Question 3, consider the scenario that the townships of North Fayette and Robinson must be served by the same hub. For Question 4, consider the scenario that the townships of Shaler and O'Hara cannot be served by the same hub. Question Scenario 1: The solution of the original model revealed that some passengers need to travel long distances to park their cars and use busses. To avoid such problems, the project team decided that the distance between a hub and a node (township) that is served by the hub cannot exceed 15 miles Question/Scenario 2: A hub cannot serve more than 3 nodes Questior/Scenario 3: The townships of Hampton and Indiana should be served by the same hub, Question/Scenario 4: The townships of South Park and Hampton cannot be served by the same hub, Question/Scenario 5: Due to budgetary restrictions in the test phase of this project, how would the solution change if you cannot locate more than three hubs? What is the oppurtunity cost of such a limitation that is, how much more would you be willing to pay to be able to locale a fourth hub? What about adding two more hubs? Determine explicity your willingness to pay for the fourth, nih...eleventh hub. Do you think that your willingness to pay for the additional number of hubs you can have is linearly dependent on the number of hubs you are already allowed to have? Question/Scenario 6: What happens if the transportation cost per mile per passenger changes to $0.50? How does the solution change? Specifically, how many facilities are located before and after the change in transportation cost? Explain why such a change occurs Exhibit 15.1 Distance Matrix between Allegheny County Townships Baldin Indians H Shaler Marshall 0 N Mecand O'lkams Phyette 17.4 33 10 Bakhtm Hampton 16.5 121 75 165 0 101 6 106 49 McCand O Han 7:4 0 HIS 118 0 87 167 144 10 13.7 10.4 18 7 46 159 26.3 15 0 17 28 215 10.6 7.5 N. Fette Robo Row Shaker 163 Park Springdale Clair 78 244 125 244 6.5 15.8 21.6 20.4 10.4 19.5 275 17.0 15.1 163 346 133 18.5 17 174 195 113 15.7 0 7.1 27.1 0 73 0 133 305 65 28.7 21.7 27.4 5.1 156 10.7 0 149 49 7.4 11 45 45 136 70 192 106 143 28.7 217 33 18.5 21.9 18.1 31.7 123 5.1 S.Pk Sportagdale Up St Clar 6.5 15.8 104 1929 0 192 13.3 157 219 144 159 17 175 1926 106 64 11 21 Payette Marshall 266 165 28.5 0 74 ISS 243 Exhibit 15.2 Daily Demand for Each Township Hampton O'Hara Pine Township Baldwin Demand 10 Township Ross Demand 156 Indiana McCandless 37 142 South Park Springdale 67 N. Fayette Robinson 67 5. Fayette Marshall 72 35 58 Upper St. Clair Shaker 144 Exhibit 15-3 Daily Operational Cost of a Hub for Each Township Ross 270 Township Cost Township Cost Baldwin 200 Shaler 190 Indiana McCandless 170 190 South Park Springdale 195 180 O'Hara 220 Upper St. Clair 205 N. Fayette 230 Marshall 260 INTRODUCTION Allegheny County Port Authority is the main organization that oversees public transportation in Allegheny County and the city of Pittsburgh. The Port Authority's 2,400 employees operate, maintain, and support bus, light rail, incline, and paratransit services for nearly 230,000 daily riders. It is the second largest such system in Pennsylvania and the eleventh largest in the United States. Due to a statewide transportation funding crisis, the Port Authority is fa- cing the largest budget cut in the agency's 48-year history. If no solution is found, 46 venerable bus routes serving several of its townships, includ- ing Mt. Lebanon, Coraopolis, Green Tree, Mt. Washington, Oakmont, Edgewood, and Sewickley, will be eliminated. Riders who aren't stranded will pay more-the authority plans a 25- to 50-cent increase in different zones. According to a summary released by the Port Authority, as part of a 35% reduction in service hours, all of the authority's current 102 bus and rail routes would be scaled down, some ending altogether and others en- countering deep drops in off-peak and weekend services. In the current version of the bus system, most buses serve between a point of origin in downtown Pittsburgh and a focal point, which is a highly demanded point for transportation, and pass through many townships in the meantime. For example, bus 61A serves Swissvale, Wilkinsburg, and also several de manded sights of Pittsburgh, such as Oakland and Downtown. The down- side of such a system is that a bus tour takes approximately 2 hours even though most of the passenger traffic is between focal points. Therefore, less-demanded regions are either served infrequently or many redundant buses are assigned to achieve a certain service rate to those less-deman- ded regions. Toto 1 To retain service, albeit at a minimal level, at all townships, and at the same time eliminate redundant bus routes, the Port Authority has started a new "park and ride" project. As the name of the project implies, there will be main parking facilities called "hubs in some of these town- ships and passengers will park their own cars in one of these hubs, and then use the bus for the remainder of their trip. Additionally, to serve cus- tomers with no cars, the Port Authority will assign shuttles that will carry passengers to parking hubs. For example, if there is a parking facility in Ross, a passenger who lives in Ross and wants to travel to Downtown will first get to the parking facility via either a shuttle or a car, and then use an express bus between the parking facility and Downtown. This way, the Port Authority plans to eliminate most of the bus routes and still cover a significant portion of its demand. The ultimate goal is to cut operational costs considerably while maintaining most of its revenue. The park-and-ride project has two main subprojects that focus on which townships will be included as hubs, which hubs will serve which town- ships, and how the shuttles will operate. The objective of the latter sub- project, called "shuttle subproject," is to determine the bus stops that will be served by the same shuttle, and to determine the number of shuttle buses needed to provide an acceptable service to the customers. This sub- project, however, is out of the scope of this case study. In this case study, you will act as a member of the team that conducts the former subproject named as the "hub subproject. To serve as the data for the hub subpro- ject, the Port Authority officials have provided you with the distance between each township, the demand of each township, and the capacity of possible parking sites that might serve as parking facilities. Your job is to determine which townships will include parking facilities (hubs) and which townships will be served by which hub. Note that we are making an implicit assumption that each township will be served by exactly one hub. PRE-ANALYSIS Before starting the model section, answer the following questions: 1. Location problems are frequently used in practice. Find two real-life ex- amples from newspapers, blogs, or journals within the last five years, in which benefits and/or failure of location (factory, warehouse, transporta- tion hub) decisions made by specific companies or government agencies are discussed. What are critical conclusions in these stories? 2. Explain the advantages of using hubs instead of serving between all possible origin-destination pairs. 3. In the current project structure, the Port Authority uses two subpro- jects to handle hub location and shuttle assignment problems. Thus, two independent optimization problems are solved to determine these de- cisions. What challenges have led to this solution approach? Would it be possible to find an alternative solution approach using the same available data? What would the challenges be of solving one optimization problem that determines everything? 4. To model the hub project, we will use a modified version of one of the facility location problems that you have likely seen before during your course of study. Which facility location problem would best fit the current problem given the data at hand? Explain why and how. Hint: Think of a hub as a facility that will be located and townships as nodes. MODEL MODEL In the Port Authority hub subproject, we will consider setting hubs in some of the townships. We will model the problem as a modified version of the fixed-charge problem. In this fixed-charge problem, townships will serve as nodes. In the data collected for the project, we are given a set of townships 1, and the de- mand of each township EI is denoted by h;. In the context of the hub subproject, a facility is located at nodej EJ if a hub is located in town- ship). Note that the set J of townships in which a hub can be located may be different than the set of townships I. For instance, some of the town- ships may not be suitable for locating a hub because there is no available space to serve as a parking facility. When a facility is located at nodeje J, the distance of another node i I to this facility is estimated by the distance of node i to nodej, which is denoted by dij. This distance gives approximate information about the distance that a customer in node i will travel to be served by a hub located at nodej. Note that this is a relatively crude distance measure; we could have instead tried to simultaneously optimize the route distance, but this would add significant complexity to the problem. In addition to this added complexity, vehicle routing prob- lems are generally operational decisions, and we only focus on the stra- tegie decisions in this case study. We will assume that the cost per unit de- mand per unit distance is a, that each hub jEJ has a capacity C (mainly determined by the availability of parking spaces) and a fixed cost off, as- sociated with locating and operating a hub to account for various adminis- trative and rental costs. The team for the hub subproject should determine whether or not The team for the hub subproject should determine ( 1 ) whether or not to place a facility at nodei EJ represented by the binary variable x and 2 ) whether a node i EI will be served at facility j, which is represented by the binary variable yy. The objective is to minimize total facility and transportation costs. Thus, the optimization problem for the Port Author- ity can be stated as follows: max fx, +hd,, , jej iel jej (1) jej s.t. Ey, = 1 for all ie I Y, S x, for all i e I, JEJ hy, sCx, for all je J (2) (3) fel (0,1} for allje J Y (0, 1) for all i e I, je J Constraint ensures that each township is served by exactly one hub. Constraint 2 states that a hub should be located at a site in order to be able to serve a township. Constraint 3 is the capacity constraint for each facility. Y; (0, 1) for all ie I,je J Constraint i ensures that each township is served by exactly one hub. Constraint 2 states that a hub should be located at a site in order to be able to serve a township. Constraint 3 is the capacity constraint for each facility DATA FOR CASE ANALYSIS In this case study, you are asked to focus on 15 distinct townships of Al- legheny County, specifically Baldwin, Hampton, Indiana, McCandless, O'Hara, Pine, North Fayette, Robinson, Ross, Shaler, South Park, Spring- dale, Upper St. Clair, South Fayette, and Marshall. Initial data analysis re- veals that these townships have medium propensity to use public trans- portation, which is sufficient to cover the fixed investments of the park- and-ride project, but insufficient to keep two-way public transportation routes. Furthermore, most of the residents of these townships have cars, and they have long commuting periods, which makes these townships ideal spots for park-and-ride facilities. You will consider each distinct township as a node. Due to the extreme cost of land and/or unavailability of the required parking space, Hamp- each township available for hub location are shown in Exhibit 15.1. As the table displays, the distances between two locations are not symmetric because the given distances represent actual road distances compiled as the shortest paths between the corresponding origin-destination pairs. Clearly, the demand behavior is quite dependent on the segment of the population, as well as the time of day considered that is, there are signi- ficant differences between regular hours versus rush (peak) hours. For the purposes of the park-and-ride project, we will focus on the rush hour be- havior of the working class. Most of the transportation occurs during this time as the target population in the park-and-ride project, the working class, gets to work and returns back home. While the contribution of occa- sional riders during day time is not negligible, the corresponding demand is very ad hoc in nature, and thus hard to model. On the other hand, we expect to see the same type of demand pattern (albeit in the opposite dir- ection) during both morning and evening rush hours for the working class; therefore, we will only focus on the evening rush hour (4:00 p.m.- 6:00 p.m. during weekdays) for this segment of the population. The es- timated average daily demand level during the evening rush hour at each node is shown in Exhibit 15.2. In the test phase of the park-and-ride project, the Port Authority has de- cided to acquire and maintain hubs of uniform size; that is, each hub can serve 200 people per day. In the later phases of the project, adjusting the capacity of each hub based on the demand level will be considered. Pre- liminary analysis also indicated that the total daily operational cost of a hub varies for each township depending on the rental rates of parking spaces, and the corresponding estimates are shown in Exhibit 15.3. Note that this cost includes the daily cost of maintaining hubs, the cost of oper- ating express buses, and daily wages of the drivers. It is also roughly es- timated that a hub has a transportation cost of $0.10 per passenger per STUDY QUESTIONS Your first and most important task is to develop and solve an appropriate facility location problem, described earlier in this chapter. You should ex- plicitly describe this main model and give the corresponding Excel spreadsheets. In addition to this, consider the following scenarios/conditions and ex- plain how the model should be modified to capture these scenarios/conditions (independent of each other for each of these ques- tions unless otherwise stated) and state the resulting optimal solution and optimal objective value in each of these cases. 1. The solution of the original model revealed that some passengers need to travel long distances to park their cars and use buses. To avoid such problems, the project team decided that the distance between a hub and a node (township) that is served by the hub cannot exceed 15 miles. 2. A hub cannot serve more than three nodes. 3. The townships of Hampton and Indiana should be served by the same hub. 4. The townships of South Park and Hampton cannot be served by the same hub. 5. Due to budgetary restrictions, in the test phase of this project, how would the solution change if you cannot locate more than three hubs? What is the opportunity cost of such a limitation; that is, how much more would you be willing to pay to be able to locate a fourth hub? What about for adding two more hubs? Determine explicitly your willingness to pay for adding two more hubs? Determine explicitly your willingness to pay for the fourth, fifth, ..., eleventh hub. Do you think that your willingness to pay for the additional number of hubs you can have is linearly dependent on the number of hubs you are already allowed to have? 6. What happens if the transportation cost per mile per passenger changes to $0.50? How does the solution change? Specifically, how many facilities are located before and after the change in transportation cost? Explain why such a change occurs. 7. Which facility location model would you use if there were no demand data present but only the condition given in question 1? Write and solve the corresponding updated integer programming model. 8. Consider an alternative scheme. It has been decided that exactly seven hubs will be opened. For purposes of fairness, every hub will receive the same daily budget. This budget is used both for operational costs of the hub and for transportation costs of townships served by the hub. Any part of the budget that is left over is considered to be lost. What is the smallest budget possible? Write and solve the corresponding updated integer pro- gramming model. 9. What modifications would you suggest to make this model more real- istic under the data restrictions explained before? What would be the cor- responding parameters needed and how can those be calculated? Is there a downside of making the model more realistic? ENDNOTE 1 All data, characters, and project names introduced throughout the case are fictional. First solve the facility location optimization model discussed in Section 3 of the case (in the current poject structure, the port authority uses two subprojects to handle hub location and shuttle assignment problems. Thus two independent optimization problems are solved to determine these decisions. What challenges have led to determine this solution approach? Would it be possible to find an alternative solution approach using the same available data? What would the challenges be of solving one optimization problem that determines everything? Then I would like you to modify your initial model to answer questions 1-6 in Section 42 of the case. Assume that each of these questions is independent from the others (ie, the analysis for question 1 does not affect that of question 2, the analysis for question 2 does not affect the analysis for question 3, and so on.). I would like you to make the following adjustments to several of the questions written in the case instead of analyzing what it written there: For Question 3, consider the scenario that the townships of North Fayette and Robinson must be served by the same hub. For Question 4, consider the scenario that the townships of Shaler and O'Hara cannot be served by the same hub. Question Scenario 1: The solution of the original model revealed that some passengers need to travel long distances to park their cars and use busses. To avoid such problems, the project team decided that the distance between a hub and a node (township) that is served by the hub cannot exceed 15 miles Question/Scenario 2: A hub cannot serve more than 3 nodes Questior/Scenario 3: The townships of Hampton and Indiana should be served by the same hub, Question/Scenario 4: The townships of South Park and Hampton cannot be served by the same hub, Question/Scenario 5: Due to budgetary restrictions in the test phase of this project, how would the solution change if you cannot locate more than three hubs? What is the oppurtunity cost of such a limitation that is, how much more would you be willing to pay to be able to locale a fourth hub? What about adding two more hubs? Determine explicity your willingness to pay for the fourth, nih...eleventh hub. Do you think that your willingness to pay for the additional number of hubs you can have is linearly dependent on the number of hubs you are already allowed to have? Question/Scenario 6: What happens if the transportation cost per mile per passenger changes to $0.50? How does the solution change? Specifically, how many facilities are located before and after the change in transportation cost? Explain why such a change occurs Exhibit 15.1 Distance Matrix between Allegheny County Townships Baldin Indians H Shaler Marshall 0 N Mecand O'lkams Phyette 17.4 33 10 Bakhtm Hampton 16.5 121 75 165 0 101 6 106 49 McCand O Han 7:4 0 HIS 118 0 87 167 144 10 13.7 10.4 18 7 46 159 26.3 15 0 17 28 215 10.6 7.5 N. Fette Robo Row Shaker 163 Park Springdale Clair 78 244 125 244 6.5 15.8 21.6 20.4 10.4 19.5 275 17.0 15.1 163 346 133 18.5 17 174 195 113 15.7 0 7.1 27.1 0 73 0 133 305 65 28.7 21.7 27.4 5.1 156 10.7 0 149 49 7.4 11 45 45 136 70 192 106 143 28.7 217 33 18.5 21.9 18.1 31.7 123 5.1 S.Pk Sportagdale Up St Clar 6.5 15.8 104 1929 0 192 13.3 157 219 144 159 17 175 1926 106 64 11 21 Payette Marshall 266 165 28.5 0 74 ISS 243 Exhibit 15.2 Daily Demand for Each Township Hampton O'Hara Pine Township Baldwin Demand 10 Township Ross Demand 156 Indiana McCandless 37 142 South Park Springdale 67 N. Fayette Robinson 67 5. Fayette Marshall 72 35 58 Upper St. Clair Shaker 144 Exhibit 15-3 Daily Operational Cost of a Hub for Each Township Ross 270 Township Cost Township Cost Baldwin 200 Shaler 190 Indiana McCandless 170 190 South Park Springdale 195 180 O'Hara 220 Upper St. Clair 205 N. Fayette 230 Marshall 260