

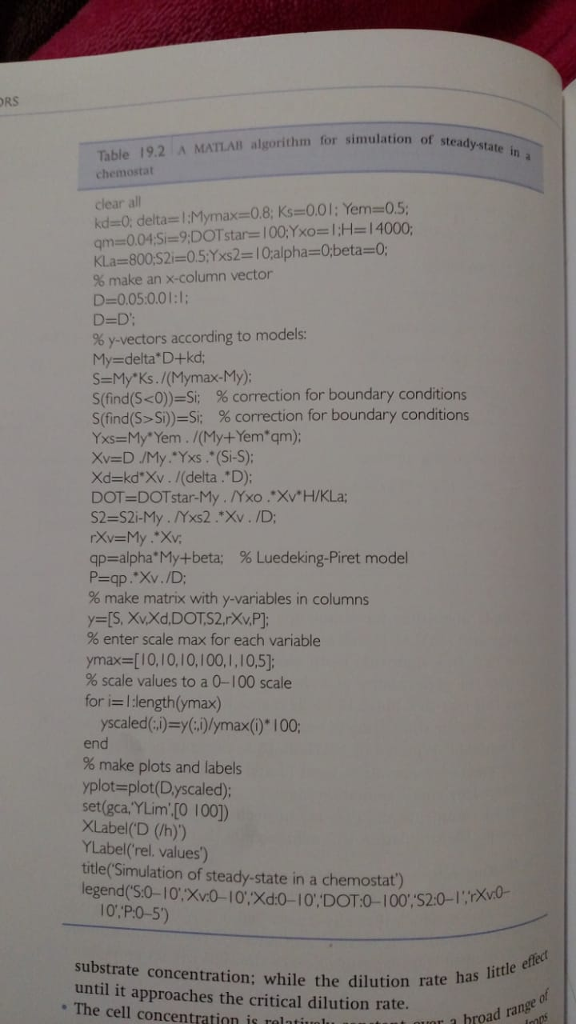
Question: Please, read my whole explanation I need some help with this MATLAB code: %------------------------------------------------------------------------------------------ clear all kd=0; delta=1; Mymax=0.8; Ks=0.01; Yem=0.5; qm=0.04; Si=9; DOTstar=100; Yxo=1;H=14000;
Please, read my whole explanation
I need some help with this MATLAB code:
%------------------------------------------------------------------------------------------
clear all
kd=0; delta=1; Mymax=0.8; Ks=0.01; Yem=0.5;
qm=0.04; Si=9; DOTstar=100; Yxo=1;H=14000;
KLa=800; S2i=0.5;Yxs2=10; alpha=0; beta=0;
%make an x-column vector
D=0.05:0.01:1;
D=D';
%y- vectors according to models
My= delta*D+ kd;
S=My*Ks./(Mymax-My);
S(S
S(S>Si)=Si; %correction for boundary conditions
Yxs= My*Yem ./ (My+Yem*qm);
Xv= D./My.*Yxs.*(Si-S);
Xd=kd*Xv./(delta.*D);
DOT=DOTstar-My./Yxo.* Xv*H/ KLa;
S2=S2i-My./Yxs2.*Xv./D;
rXv=My.* Xv;
qp=alpha*My+ beta; % Luedeking-Piret model
P=qp.*Xv./D;
%make matrix with y-variables in columns
y=[S,Xv,Xd,DOT,S2,rXv,P];
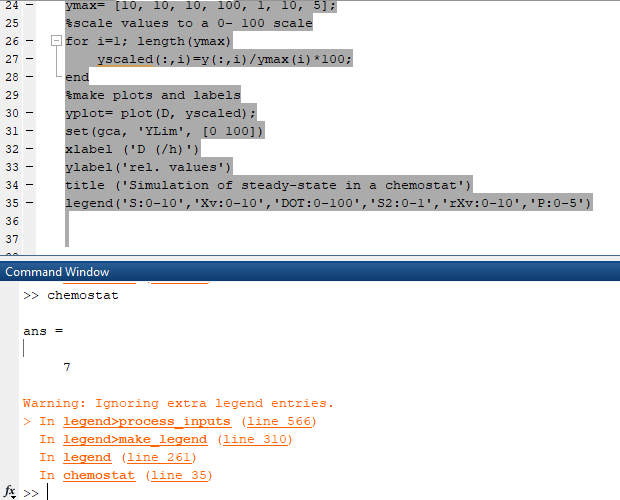
%enter scale max for each variable
ymax= [10, 10, 10, 100, 1, 10, 5];
%scale values to a 0- 100 scale
for i=1; length(ymax)
yscaled(:,i)=y(:,i)/ymax(i)*100;
end
%make plots and labels
yplot= plot(D, yscaled);
set(gca, 'YLim', [0 100])
xlabel ('D (/h)')
ylabel('rel. values')
title ('Simulation of steady-state in a chemostat')
legend('S:0-10','Xv:0-10','DOT:0-100','S2:0-1','rXv:0-10','P:0-5')
%-------------------------------------------------------------------------------------------------------------------------
I must say that I found the script on a Google book (id=fJMgAwAAQBAJ&pg)
Basic Biotechnology

Colin Ratledge, Bjorn Kristiansen
Cambridge University Press, May 25, 2006
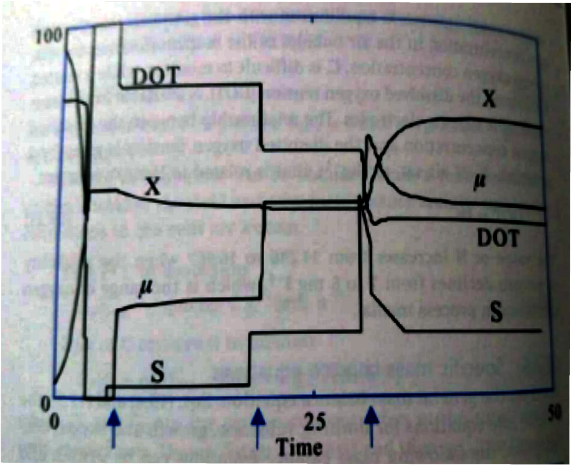
Supposedly, the code plots something like this
but at the end I just get the following figure
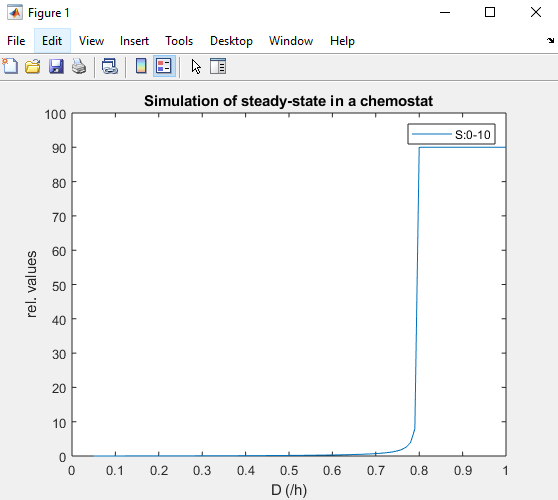
I think it is because of this, but I do not know how to fix it
RS algorithm for simulation of steadystate in Table 19.2 A MATLAII chemostat clear all kd 0, delta-1:Mymax-08; Ks-0.01: Yem-0.5 % make an x-column vector D=0.05:0.0 1 : 1 ; % y-vectors according to models My-delta D+kd; $(find(ScO) Si; sfindS-Si))-S; % correction for boundary conditions % correction for boundary conditions xdakd'XL /(delta ."D); DOT-DOTstar-My. Yxo."Xv'H/KLa; ap alpha"My-beta; % Luedeking-Piret model P-qp.Xv./D; % make matrix with y-variables in columns % enter scale max for each variable ymax [I0,10,10,100,1,10,51 % scale values to a 0-100 scale for i :length(ymax) yscaled(i) y(i)/ymax() 100; end % make plots and labels yplot-plot(Dyscaled); set(gca,YLim [O 100]) XLabel(D (/h)) YLabel(rel. values) title(Simulation of steady-state in a chemostat) legend(S.0-10:Xvo-10:Xd0-10 DOT0-100;S20-'r 10:PO-5) substrate concentration; while the dilution rate until it approaches the critical dilution rate. has little effect . The cell concentration is hroad range
Step by Step Solution
There are 3 Steps involved in it

Get step-by-step solutions from verified subject matter experts