Answered step by step
Verified Expert Solution
Link Copied!

Question

1 Approved Answer

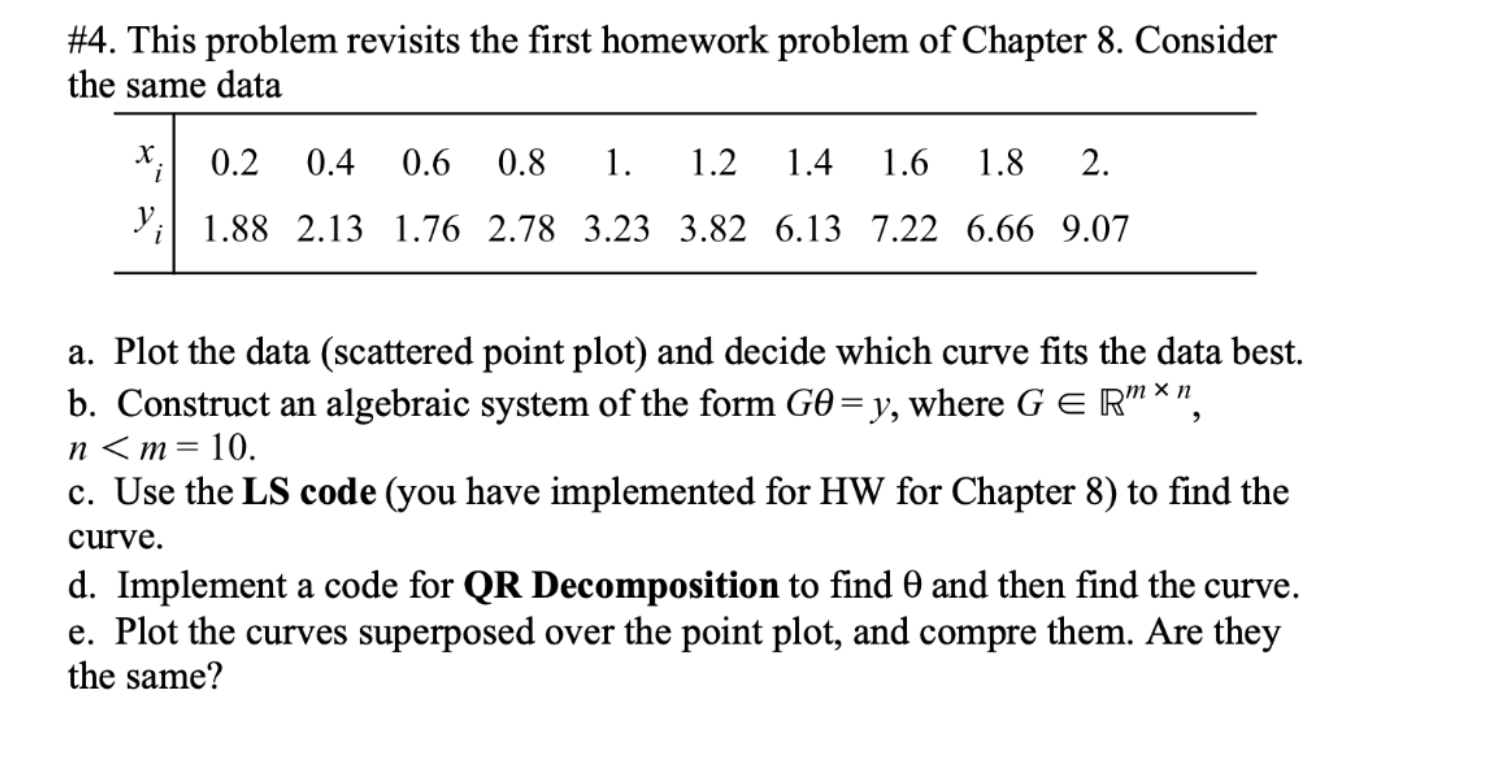
Please read the whole question carefully. The question is complete and from a numerical analysis course. The previous problem is given below. #5. For the

Please read the whole question carefully. The question is complete and from a numerical analysis course. image text in transcribedThe previous problem is given below.

image text in transcribed

#5. For the overdetermined system in the previous problem, use the SVD to find the least-squares solution. Your solution must be the same as the one found in the previous problem. For the SVD, you may use SingularValues (in Maple) or svd (in Matlab). #4. This problem revisits the first homework problem of Chapter 8. Consider the same data x;] 0.2 0.4 0.6 0.8 1. 1.2 1.4 1.6 1.8 2. y;| 1.88 2.13 1.76 2.78 3.23 3.82 6.13 7.22 6.66 9.07 a. Plot the data (scattered point plot) and decide which curve fits the data best. b. Construct an algebraic system of the form GO=y, where GER"*", n

Step by Step Solution

There are 3 Steps involved in it

Step: 1

blur-text-image

Get Instant Access to Expert-Tailored Solutions

See step-by-step solutions with expert insights and AI powered tools for academic success

Step: 2

blur-text-image_2

Step: 3

blur-text-image_3

Ace Your Homework with AI

Get the answers you need in no time with our AI-driven, step-by-step assistance

Get Started

Recommended Textbook for

Harness The Power Of Big Data The IBM Big Data Platform

Authors: Paul Zikopoulos, David Corrigan James Giles Thomas Deutsch Krishnan Parasuraman Dirk DeRoos Paul Zikopoulos

1st Edition

0071808183, 9780071808187

More Books

Students also viewed these Databases questions

Question

14-18 Compare the two major types of planning and control tools.

Answered: 1 week ago