please see attached charts for accurate data 
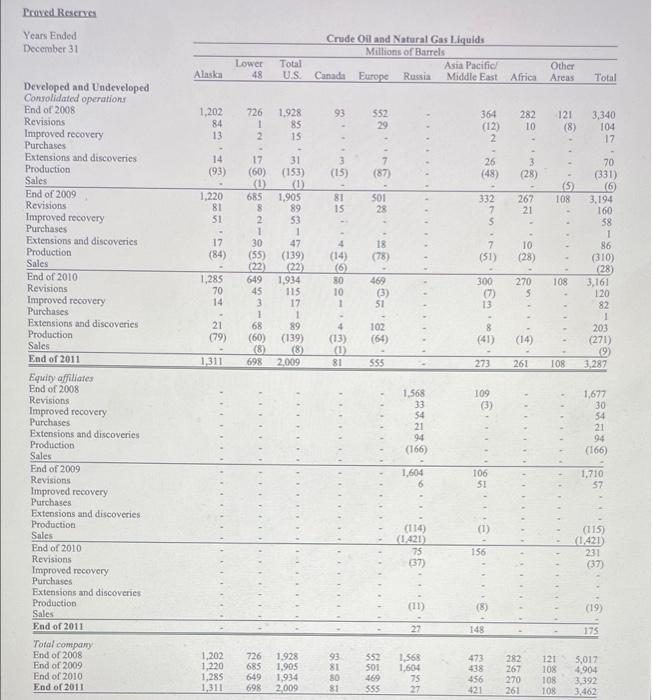
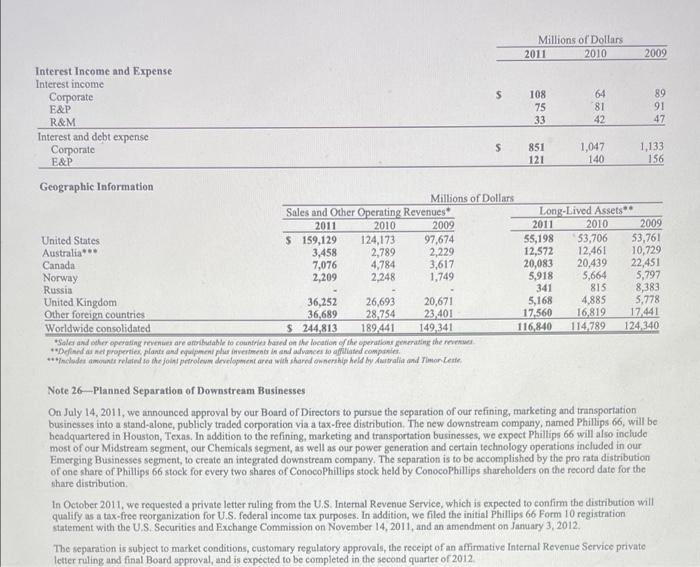
Calculate the 2014 Finding and Development (F&D) Reserve Replacement Ratio (for NATURAL GAS, Consolidated operations) Hint: See page 142 of the 10-K report. Note: Compute the above ratio in for ConocoPhillips using the 2014 10-K filing you have been provided on the course content Type your answers and show your work. Vi credit is given if a question is attempted but it is wrong. If a student does not provide evidence of their work, credit will not be given - so be sure to show your calculations. Edit View Insert Format Tools Table 12pt v Paragraph B I U Alu Tv : Proved Reserves Years Ended December 31 Lower 48 Alaska Crude Oil and Natural Gas Liquids Millions of Barrels Asia Pacific Canada Europe Russia Middle East Total U.S. Other Areas Africa Total 93 1,202 84 13 726 1 2 1.928 85 15 552 29 364 (12) 2 282 10 121 (8) ..... 3,340 104 17 14 (93) 17 (60) (0) (15) 7 (87) 26 (48) 3 (28) (5) 108 1,220 81 SI 8. 15 501 28 267 21 8 2 1 30 (55) 332 7 S - 7 (51) 17 (84) 31 (153) (0 1.905 89 53 1 47 (139) (22) 1,934 115 17 1 89 (139) 8) 2,009 18 (78) 10 (28) 70 (331) (6) 3.194 160 58 1 86 (310) (28) 3,161 120 82 1 203 (271) 9) 3.287 4 (14) (6) 80 10 1 1,285 70 14 108 469 (3) 51 300 (7) 13 270 5 21 (79) 45 3 1 68 (60) (8) 102 8 4 (13) (0 81 (14) 1,311 555 273 261 TOR Developed and Undeveloped Consolidated operations End of 2008 Revisions Improved recovery Purchases Extensions and discoveries Production Sales End of 2009 Revisions Improved recovery Purchases Extensions and discoveries Production Sales End of 2010 Revisions Improved recovery Purchases Extensions and discoveries Production Sales End of 2011 Equity afiliates End of 2008 Revisions Improved recovery Purchases Extensions and discoveries Production Sales End of 2009 Revisions Improved recovery Purchases Extensions and discoveries Production Sales End of 2010 Revisions Improved recovery Purchases Extensions and discoveries Production Sales End of 2011 Total company End of 2008 End of 2009 End of 2010 End of 2011 (3) 1.568 33 54 21 94 (166) 1,677 30 54 21 94 (166) 1,604 6 1,710 57 a..............3 ( (114) 1.421 75 (37) (115) (1.421) 231 (37) (11) (19) 27 175 1,202 1,220 1,285 1,311 726 685 649 698 1,928 1.905 1,934 2,009 93 81 80 81 552 501 469 555 1,568 1.604 75 27 282 267 270 261 121 108 108 108 5,017 4,904 3,392 3.462 Millions of Dollars 2011 2010 2009 Interest Income and Expense Interest income Corporate s 108 64 89 E&P 75 81 91 R&M 33 42 47 Interest and debt expense Corporate S 851 1,047 1,133 E&P 121 140 156 Geographic Information Millions of Dollars Sales and Other Operating Revenues Long Lived Assets 2011 2010 2009 2011 2010 2009 United States $ 159,129 124,173 97,674 55,198 53,706 53,761 Australia 3,458 2,789 2,229 12,572 12.461 10,729 Canada 7,076 4,784 3,617 20,083 20.439 22,451 Norway 2,209 2,248 1.749 5,918 5,664 5,797 Russia 341 815 8,383 United Kingdom 36,252 26,693 20,671 5,168 4,885 5,778 Other foreign countries 36,689 28 754 23,401 17,560 16,819 17.441 Worldwide consolidated $ 244,813 189.441 149.341 116,840 114 789 124, 340 *Solar and other operating revents are attributable to countries based on the location of the operations generating the **Deans et properties plante arquent per investment in and advances soaped companie ***included amounts related to the joint petroleo development area with shared ownership held by Australia and Timor Lette Note 26-Planned Separation of Downstream Businesses On July 14, 2011, we announced approval by our Board of Directors to pursue the separation of our refining, marketing and transportation businesses into a stand-alone, publicly traded corporation via a tax-free distribution. The new downstream company named Phillips 66, will be headquartered in Houston, Texas. In addition to the refining, marketing and transportation businesses, we expect Phillips 66 will also include most of our Midstream segment, our Chemicals segment, as well as our power generation and certain technology operations included in our Emerging Businesses segment, to create an integrated downstream company. The separation is to be accomplished by the pro rata distribution of one share of Phillips 66 stock for every two shares of ConocoPhillips stock held by ConocoPhillips shareholders on the record date for the share distribution In October 2011, we requested a private letter ruling from the U.S. Internal Revenue Service, which is expected to confirm the distribution will qualify as a tax-free reorganization for U.S. federal income tax purposes. In addition, we filed the initial Phillips 66 Form 10 registration statement with the U.S. Securities and Exchange Commission on November 14, 2011, and an amendment on January 3, 2012, The separation is subject to market conditions, customary regulatory approvals, the receipt of an affirmative Internal Revenue Service private letter ruling and final Board approval, and is expected to be completed in the second quarter of 2012 Calculate the 2014 Finding and Development (F&D) Reserve Replacement Ratio (for NATURAL GAS, Consolidated operations) Hint: See page 142 of the 10-K report. Note: Compute the above ratio in for ConocoPhillips using the 2014 10-K filing you have been provided on the course content Type your answers and show your work. Vi credit is given if a question is attempted but it is wrong. If a student does not provide evidence of their work, credit will not be given - so be sure to show your calculations. Edit View Insert Format Tools Table 12pt v Paragraph B I U Alu Tv : Proved Reserves Years Ended December 31 Lower 48 Alaska Crude Oil and Natural Gas Liquids Millions of Barrels Asia Pacific Canada Europe Russia Middle East Total U.S. Other Areas Africa Total 93 1,202 84 13 726 1 2 1.928 85 15 552 29 364 (12) 2 282 10 121 (8) ..... 3,340 104 17 14 (93) 17 (60) (0) (15) 7 (87) 26 (48) 3 (28) (5) 108 1,220 81 SI 8. 15 501 28 267 21 8 2 1 30 (55) 332 7 S - 7 (51) 17 (84) 31 (153) (0 1.905 89 53 1 47 (139) (22) 1,934 115 17 1 89 (139) 8) 2,009 18 (78) 10 (28) 70 (331) (6) 3.194 160 58 1 86 (310) (28) 3,161 120 82 1 203 (271) 9) 3.287 4 (14) (6) 80 10 1 1,285 70 14 108 469 (3) 51 300 (7) 13 270 5 21 (79) 45 3 1 68 (60) (8) 102 8 4 (13) (0 81 (14) 1,311 555 273 261 TOR Developed and Undeveloped Consolidated operations End of 2008 Revisions Improved recovery Purchases Extensions and discoveries Production Sales End of 2009 Revisions Improved recovery Purchases Extensions and discoveries Production Sales End of 2010 Revisions Improved recovery Purchases Extensions and discoveries Production Sales End of 2011 Equity afiliates End of 2008 Revisions Improved recovery Purchases Extensions and discoveries Production Sales End of 2009 Revisions Improved recovery Purchases Extensions and discoveries Production Sales End of 2010 Revisions Improved recovery Purchases Extensions and discoveries Production Sales End of 2011 Total company End of 2008 End of 2009 End of 2010 End of 2011 (3) 1.568 33 54 21 94 (166) 1,677 30 54 21 94 (166) 1,604 6 1,710 57 a..............3 ( (114) 1.421 75 (37) (115) (1.421) 231 (37) (11) (19) 27 175 1,202 1,220 1,285 1,311 726 685 649 698 1,928 1.905 1,934 2,009 93 81 80 81 552 501 469 555 1,568 1.604 75 27 282 267 270 261 121 108 108 108 5,017 4,904 3,392 3.462 Millions of Dollars 2011 2010 2009 Interest Income and Expense Interest income Corporate s 108 64 89 E&P 75 81 91 R&M 33 42 47 Interest and debt expense Corporate S 851 1,047 1,133 E&P 121 140 156 Geographic Information Millions of Dollars Sales and Other Operating Revenues Long Lived Assets 2011 2010 2009 2011 2010 2009 United States $ 159,129 124,173 97,674 55,198 53,706 53,761 Australia 3,458 2,789 2,229 12,572 12.461 10,729 Canada 7,076 4,784 3,617 20,083 20.439 22,451 Norway 2,209 2,248 1.749 5,918 5,664 5,797 Russia 341 815 8,383 United Kingdom 36,252 26,693 20,671 5,168 4,885 5,778 Other foreign countries 36,689 28 754 23,401 17,560 16,819 17.441 Worldwide consolidated $ 244,813 189.441 149.341 116,840 114 789 124, 340 *Solar and other operating revents are attributable to countries based on the location of the operations generating the **Deans et properties plante arquent per investment in and advances soaped companie ***included amounts related to the joint petroleo development area with shared ownership held by Australia and Timor Lette Note 26-Planned Separation of Downstream Businesses On July 14, 2011, we announced approval by our Board of Directors to pursue the separation of our refining, marketing and transportation businesses into a stand-alone, publicly traded corporation via a tax-free distribution. The new downstream company named Phillips 66, will be headquartered in Houston, Texas. In addition to the refining, marketing and transportation businesses, we expect Phillips 66 will also include most of our Midstream segment, our Chemicals segment, as well as our power generation and certain technology operations included in our Emerging Businesses segment, to create an integrated downstream company. The separation is to be accomplished by the pro rata distribution of one share of Phillips 66 stock for every two shares of ConocoPhillips stock held by ConocoPhillips shareholders on the record date for the share distribution In October 2011, we requested a private letter ruling from the U.S. Internal Revenue Service, which is expected to confirm the distribution will qualify as a tax-free reorganization for U.S. federal income tax purposes. In addition, we filed the initial Phillips 66 Form 10 registration statement with the U.S. Securities and Exchange Commission on November 14, 2011, and an amendment on January 3, 2012, The separation is subject to market conditions, customary regulatory approvals, the receipt of an affirmative Internal Revenue Service private letter ruling and final Board approval, and is expected to be completed in the second quarter of 2012