

Answered step by step
Verified Expert Solution
Question
1 Approved Answer
please see insructions for question 1 in the pictures below. the last two photos are examples of what the excel sheet should look like. Plant
please see insructions for question 1 in the pictures below. the last two photos are examples of what the excel sheet should look like. 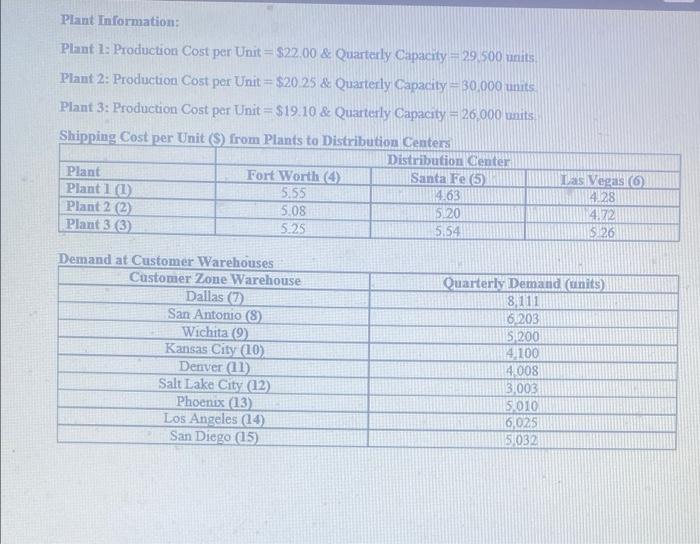
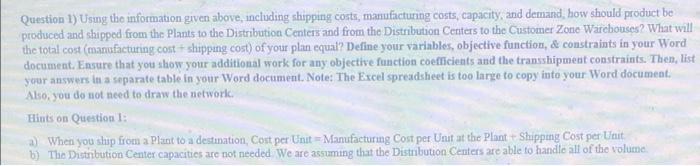
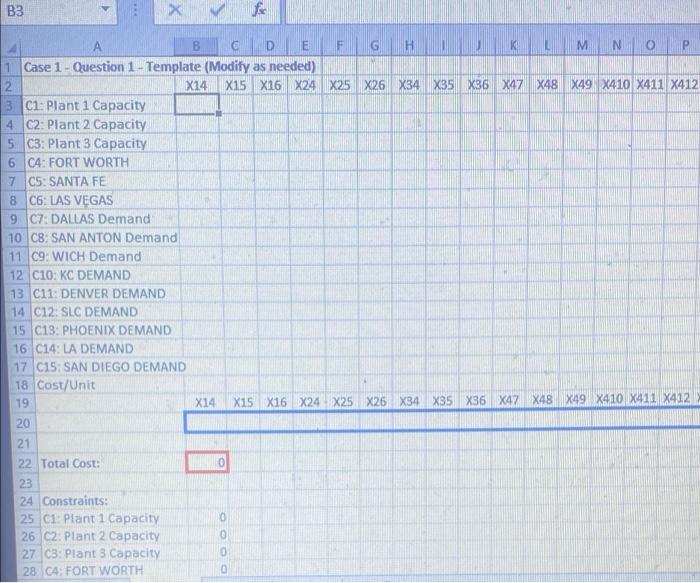
 Plant Information: Plant 1: Production Cost per Unit= $22.00 & Quarterly Capacity= 29 500 units Plant 2: Production Cost per Unit = $20 25 & Quarterly Capacity - 30,000 units Plant 3: Production Cost per Unit = $19.10 & Quarterly Capacity = 26.000 units Shipping Cost per Unit (S) from Plants to Distribution Centers Distribution Center Plant Fort Worth (4) Santa Fe (5) Plantil 5.55 4.63 Plant 2 (2) 5.08 5.20 Plant 3 (3) 5.25 5:54 Las Vegas 4.28 4.72 $126 Demand at Customer Warehouses Customer Zone Warehouse Dallas San Antonio (8) Wichita (9) Kansas City (10) Denver (11) Salt Lake City 12 Phoenix (13) Los Angeles (14) San Diego (15) Quarterly Demand units) 8,111 6203 5200 4.100 4.008 3,003 5.010 6,025 5032 Question 1) Using the information given above, including shipping costs, manufacturing costs, capacity, and demand how should product be produced and shipped from the Plants to the Distribution Centers and from the Distribution Centers to the Customer Zone Warehouses? What will the total cost (manufacturing cost + shipping cost of your plan equal? Define your variables, objective function, & constraints in your Word document. Ensure that you slow your additional work for any objective function coefficients and the transshipment constraints. Then, list your answers in a separate table in your Word document. Note: The Excel spreadsheet is too large to copy into your Word document, Also, you do not need to draw the network Hints on Question 1: a) When you slup from a Plant to a destination, Cost per Unit - Manufacturing Cost per Unit at the Plant Shipping Cost per Unit b) The Distribution Center capacities are not needed. We are assuming that the Distribution Centers are able to handle all of the volume B3 X B C D E F G H M N o P 1 Case 1 - Question 1- Template (Modify as needed) 2 X14 X15 X16 X24 X25X26X34 235 236 X47X48 X49X410 411 412 3 C1: Plant 1 Capacity 4 C2: Plant 2 Capacity 5. C3: Plant 3 Capacity 6 C4: FORT WORTH 7 CS: SANTA FE 8 C6: LAS VEGAS 9 C7: DALLAS Demand 10 C8. SAN ANTON Demand 11 09: WICH Demand 12 C10: KC DEMAND 13 C11 DENVER DEMAND 14 C12: SLC DEMAND 15 C13: PHOENIX DEMAND 16 C14: LA DEMAND 17 CIS: SAN DIEGO DEMAND 18 Cost/Unit 19 X14 X15X16 X24 X25 X26X34X35 X36 47 48 49 X410 411 412 20 21 22 Total Cost: 0 23 24 Constraints: 25 CI: Plant 1 Capacity 0 26 C2. Plant 2 Capacity 0 27 03: Plant 3 Capacity 0 28 C4: FORT WORTH K M N o Q R 5 T U w X Y Z - MAB AC AD AL AG AH AL 2 AU AK ALAM > S X36 XA2 X48X49 X410 411 X412 2413 414 415 XS7 358 459 X510 X5 X512 513 X514 X515X67 68 69. X610 X611 X612X613 X626 05 3 X36 247 248 249 X410 411 412 413 414 415 X5 X58 259 X5 X511 X512 X3 X514 X515 X5 X68X69X510 X611 X512X613 614 615
please see insructions for question 1 in the pictures below. the last two photos are examples of what the excel sheet should look like.
Step by Step Solution
There are 3 Steps involved in it
Step: 1

Get Instant Access to Expert-Tailored Solutions
See step-by-step solutions with expert insights and AI powered tools for academic success
Step: 2

Step: 3
Ace Your Homework with AI
Get the answers you need in no time with our AI-driven, step-by-step assistance
Get Started
Emotions In Finance Booms Busts And Uncertainty
Authors: Jocelyn Pixley
2nd Edition
1107633370, 978-1107633377