please see the attached photo..
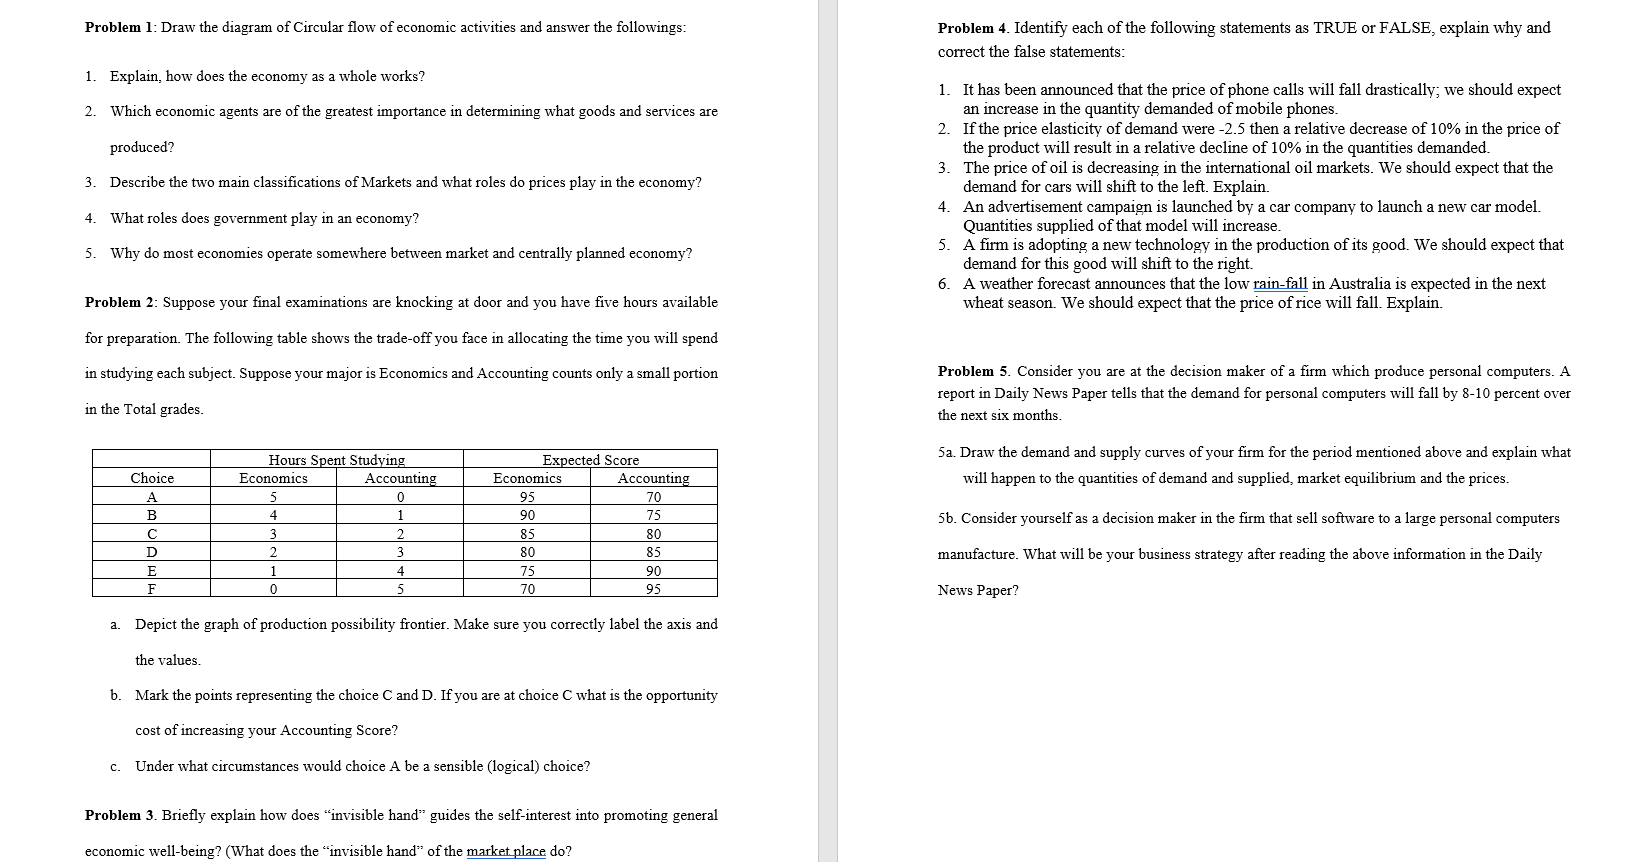
Problem 1: Draw the diagram of Circular flow of economic activities and answer the followings: Problem 4. Identify each of the following statements as TRUE or FALSE, explain why and correct the false statements: 1. Explain, how does the economy as a whole works? 1. It has been announced that the price of phone calls will fall drastically; we should expect 2. Which economic agents are of the greatest importance in determining what goods and services are an increase in the quantity demanded of mobile phones. 2. If the price elasticity of demand were -2.5 then a relative decrease of 10% in the price of produced? the product will result in a relative decline of 10% in the quantities demanded 3. Describe the two main classifications of Markets and what roles do prices play in the economy? 3. The price of oil is decreasing in the international oil markets. We should expect that the demand for cars will shift to the left. Explain. What roles does government play in an economy? 4. An advertisement campaign is launched by a car company to launch a new car model. Quantities supplied of that model will increase. 5. Why do most economies operate somewhere between market and centrally planned economy? 5. A firm is adopting a new technology in the production of its good. We should expect that demand for this good will shift to the right. 6. A weather forecast announces that the low rain-fall in Australia is expected in the next Problem 2: Suppose your final examinations are knocking at door and you have five hours available wheat season. We should expect that the price of rice will fall. Explain. for preparation. The following table shows the trade-off you face in allocating the time you will spend in studying each subject. Suppose your major is Economics and Accounting counts only a small portion Problem 5. Consider you are at the decision maker of a firm which produce personal computers. A in the Total grades. report in Daily News Paper tells that the demand for personal computers will fall by 8-10 percent over the next six months Hours Spent Studying Expected Score 5a. Draw the demand and supply curves of your firm for the period mentioned above and explain what Choice Economics Accounting Economics Accounting will happen to the quantities of demand and supplied, market equilibrium and the prices. A 0 70 B 4 90 75 C 3 5b. Consider yourself as a decision maker in the firm that sell software to a large personal computers 85 80 D 80 E LAWN 85 manufacture. What will be your business strategy after reading the above information in the Daily 74 90 70 95 News Paper? a. Depict the graph of production possibility frontier. Make sure you correctly label the axis and the values. b. Mark the points representing the choice C and D. If you are at choice C what is the opportunity cost of increasing your Accounting Score? c. Under what circumstances would choice A be a sensible (logical) choice? Problem 3. Briefly explain how does "invisible hand" guides the self-interest into promoting general economic well-being? (What does the "invisible hand" of the market place do


