

Answered step by step
Verified Expert Solution
Question
1 Approved Answer
please show me the formulas to use b. Now conduct a sensitivity analysis to determine the sensitivity of NPV to changes in the sales price,
please show me the formulas to use 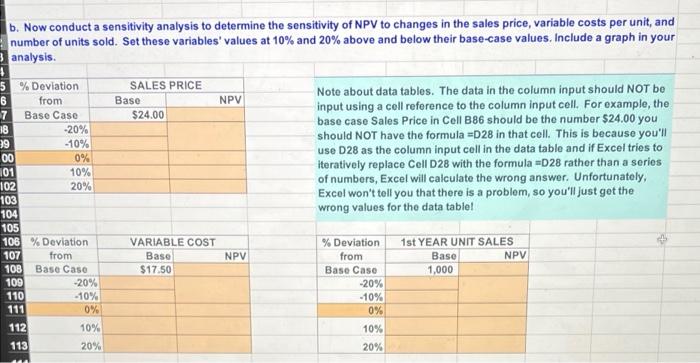
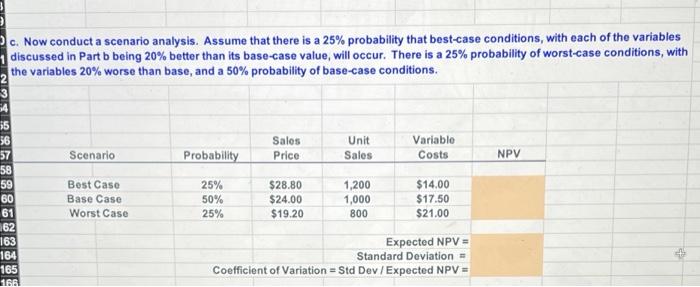
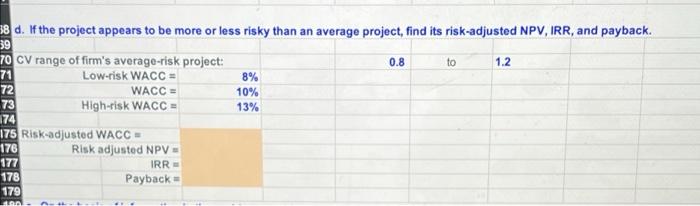
b. Now conduct a sensitivity analysis to determine the sensitivity of NPV to changes in the sales price, variable costs per unit, and number of units sold. Set these variables' values at 10% and 20% above and below their base-case values. Include a graph in your analysis. 5 % Deviation SALES PRICE 6 from NPV Base Case $24.00 Note about data tables. The data in the column input should NOT be input using a cell reference to the column input cell. For example, the base case Sales Price in Cell B86 should be the number $24.00 you should NOT have the formula =D28 in that cell. This is because you'll use D28 as the column input cell in the data table and if Excel tries to iteratively replace Cell D28 with the formula =D28 rather than a series of numbers, Excel will calculate the wrong answer. Unfortunately, Excel won't tell you that there is a problem, so you'll just get the wrong values for the data table! % Deviation VARIABLE COST Base 1st YEAR UNIT SALES NPV from Base $17.50 Base Case 7 18 39 -20% -10% 00 0% 01 10% 102 20% 103 104 105 106 % Deviation 107 from 108 Base Case 109 110 111 112 113 -20% -10% 0% 10% 20% Base NPV -20% -10% 0% 10% 20% 1,000 c. Now conduct a scenario analysis. Assume that there is a 25% probability that best-case conditions, with each of the variables discussed in Part b being 20% better than its base-case value, will occur. There is a 25% probability of worst-case conditions, with the variables 20% worse than base, and a 50% probability of base-case conditions. 54 55 56 Unit Sales Price: Variable Costs 57 Scenario Probability Sales NPV 58 59 25% $28.80 1,200 $14.00 Best Case Base Case Worst Case 50% $24.00 1,000 $17.50 25% $19.20 800 $21.00 Expected NPV = Standard Deviation = Coefficient of Variation = Std Dev / Expected NPV = 60 38283 28 162 163 164 165 166 38 d. If the project appears to be more or less risky than an average project, find its risk-adjusted NPV, IRR, and payback. 39 70 CV range of firm's average-risk project: 0.8 to 1.2 71 Low-risk WACC = 8% 10% 72 WACC = 73 High-risk WACC = 13% 174 175 Risk-adjusted WACC = 176 Risk adjusted NPV = 177 IRR = 178 Payback = 179 400 Step by Step Solution
There are 3 Steps involved in it
Step: 1

Get Instant Access to Expert-Tailored Solutions
See step-by-step solutions with expert insights and AI powered tools for academic success
Step: 2

Step: 3
Ace Your Homework with AI
Get the answers you need in no time with our AI-driven, step-by-step assistance
Get Started
Personal Finance
Authors: Thomas Garman, Raymond Forgue
12th edition
9781305176409, 1133595839, 1305176405, 978-1133595830