Answered step by step
Verified Expert Solution
Link Copied!

Question

1 Approved Answer

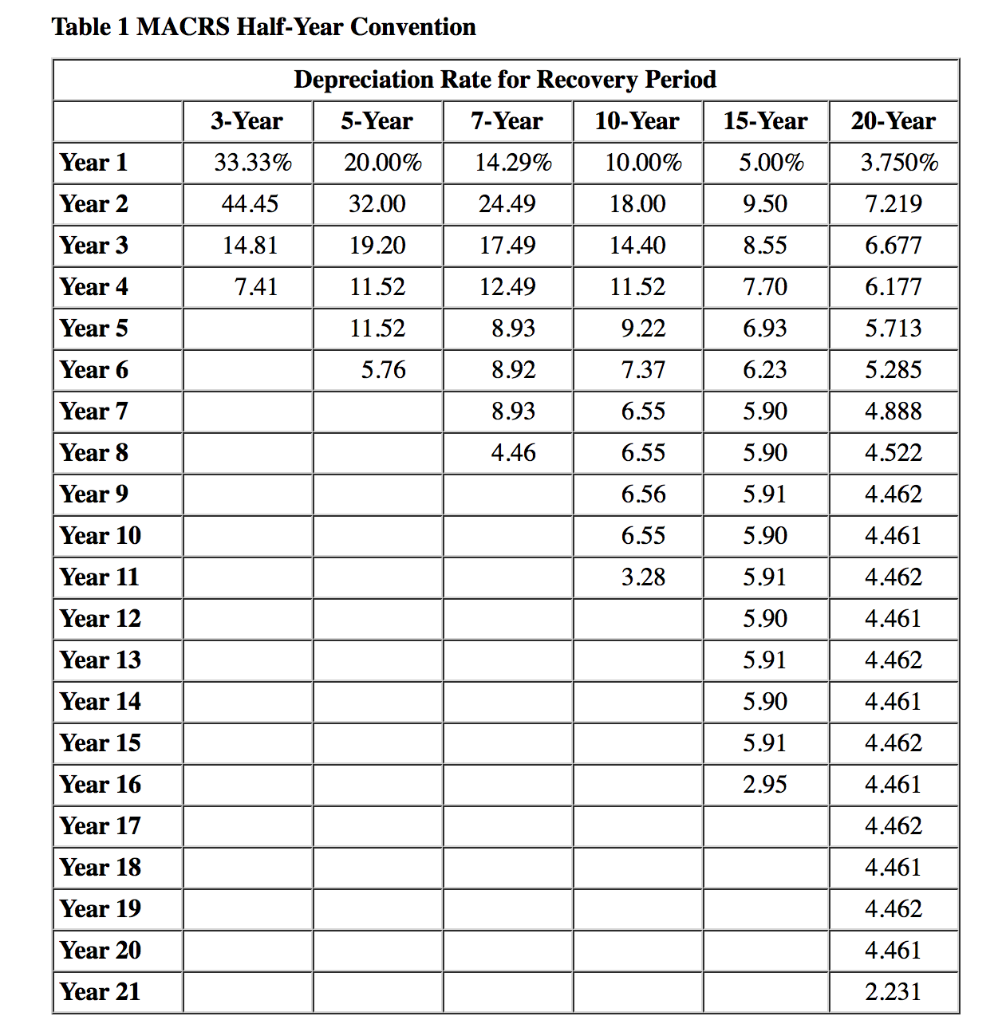
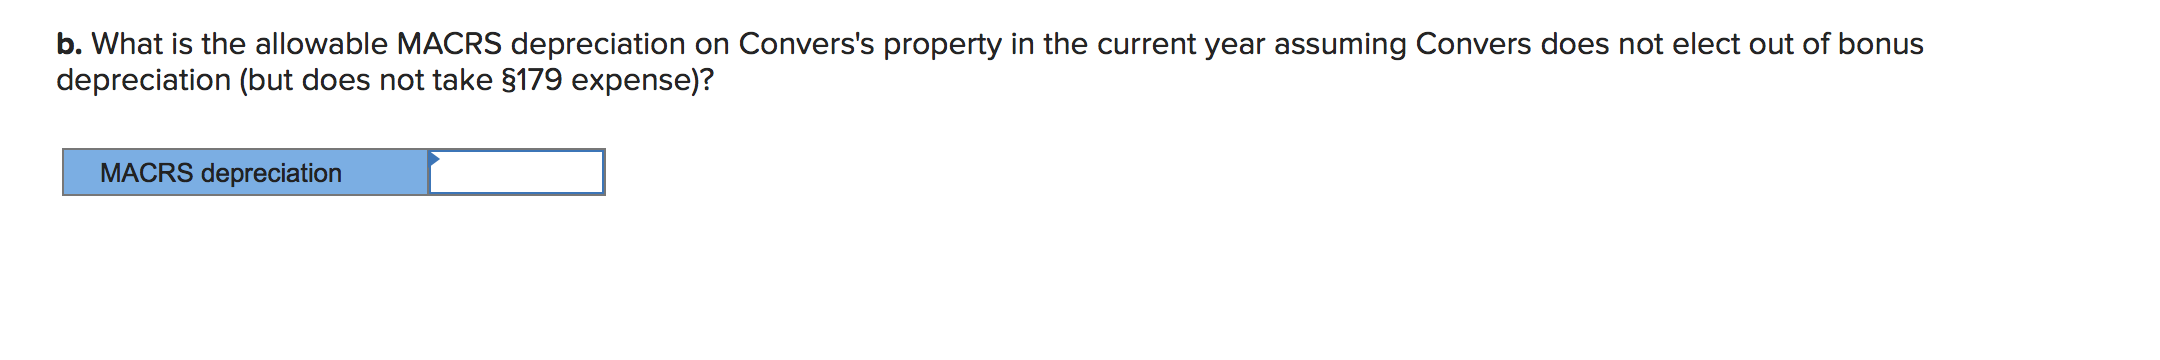
Please show work possible. Thank you very much. Table 1 MACRS Half-Year Convention Depreciation Rate for Recovery Period 3-Year 5-Year 7-Year 10-Year 15-Year 20-Year Year

Please show work possible. Thank you very much.

image text in transcribedimage text in transcribedimage text in transcribedimage text in transcribedimage text in transcribedimage text in transcribed

Table 1 MACRS Half-Year Convention Depreciation Rate for Recovery Period 3-Year 5-Year 7-Year 10-Year 15-Year 20-Year Year 1 33.33% 20.00% 14.29% 10.00% 5.00% 3.750% Year 2 44.45 32.00 24.49 18.00 9.50 7.219 Year 3 14.81 19.20 17.49 14.40 8.55 6.677 Year 4 7.41 11.52 12.49 11.52 7.70 6.177 Year 5 11.52 8.93 9.22 6.93 5.713 5.285 Year 6 5.76 8.92 7.37 6.23 Year 7 8.93 6.55 5.90 4.888 Year 8 4.46 6.55 5.90 4.522 Year 9 6.56 5.91 4.462 Year 10 6.55 5.90 4.461 Year 11 3.28 5.91 4.462 Year 12 5.90 4.461 Year 13 5.91 4.462 Year 14 5.90 4.461 Year 15 5.91 4.462 Year 16 2.95 4.461 Year 17 4.462 Year 18 4.461 Year 19 4.462 Year 20 4.461 Year 21 2.231 TABLE 2a MACRS Mid-Quarter Convention: For property placed in service during the first quarter Depreciation Rate for Recovery Period 5-Year 7-Year Year 1 35.00% 25.00% Year 2 26.00 21.43 Year 3 15.60 15.31 Year 4 11.01 10.93 Year 5 11.01 8.75 Year 6 1.38 8.74 Year 7 8.75 Year 8 1.09 TABLE 26 MACRS Mid-Quarter Convention: For property placed in service during the second quarter Depreciation Rate for Recovery Period 5-Year 7-Year Year 1 25.00% 17.85% Year 2 30.00 23.47 Year 3 18.00 16.76 Year 4 11.37 11.97 Year 5 11.37 8.87 Year 6 4.26 8.87 Year 7 8.87 Year 8 3.34 TABLE 2c MACRS Mid-Quarter Convention: For property placed in service during the third quarter Depreciation Rate for Recovery Period 5-Year 7-Year Year 1 15.00% 10.71% Year 2 34.00 25.51 Year 3 20.40 18.22 Year 4 12.24 13.02 Year 5 11.30 9.30 Year 6 7.06 8.85 Year 7 8.86 Year 8 5.53 TABLE MACRS-Mid Quarter Convention: For property placed rvice during the fourth quarter Depreciation Rate for Recovery Period 5-Year 7-Year Year 1 5.00% 3.57% Year 2 38.00 27.55 Year 3 22.80 19.68 Year 4 13.68 14.06 Year 5 10.94 10.04 Year 6 9.58 8.73 Year 7 8.73 Year 8 7.64 TABLE 5 Nonresidential Real Property Mid-Month Convention Straight Line39 Years (for assets placed in service on or after May 13, 1993) Month 1 Month 2 Month 3 Month 4 Month Property Placed in Service Month 5 Month 6 Month 7 1.605% 1.391% 1.177% Month 8 Month 9 Month 10 Month 11 Month 12 Year 1 2.461% 2.247% 2.033% 1.819% 0.963% 0.749% 0.535% 0.321% 0.107% Year 239 2.564 2.564 2.564 2.564 2.564 2.564 2.564 2.564 2.564 2.564 2.564 2.564 Year 40 0.107 0.321 0.535 0.749 0.963 1.177 1.391 1.605 1.819 2.033 2.247 2.461 b. What is the allowable MACRS depreciation on Convers's property in the current year assuming Convers does not elect out of bonus depreciation (but does not take $179 expense)? MACRS depreciation

Step by Step Solution

There are 3 Steps involved in it

Step: 1

blur-text-image

Get Instant Access to Expert-Tailored Solutions

See step-by-step solutions with expert insights and AI powered tools for academic success

Step: 2

blur-text-image

Step: 3

blur-text-image

Ace Your Homework with AI

Get the answers you need in no time with our AI-driven, step-by-step assistance

Get Started

Recommended Textbook for

Managerial Accounting 1

Authors: Ray H. Garrison

1st Edition

1259114457, 978-1259114458

More Books

Students also viewed these Accounting questions

Question

What is the default value of a reference?

Answered: 1 week ago

Question

Is conflict always unhealthy? Why or why not? (Objective 4)

Answered: 1 week ago