Answered step by step
Verified Expert Solution
Question
1 Approved Answer
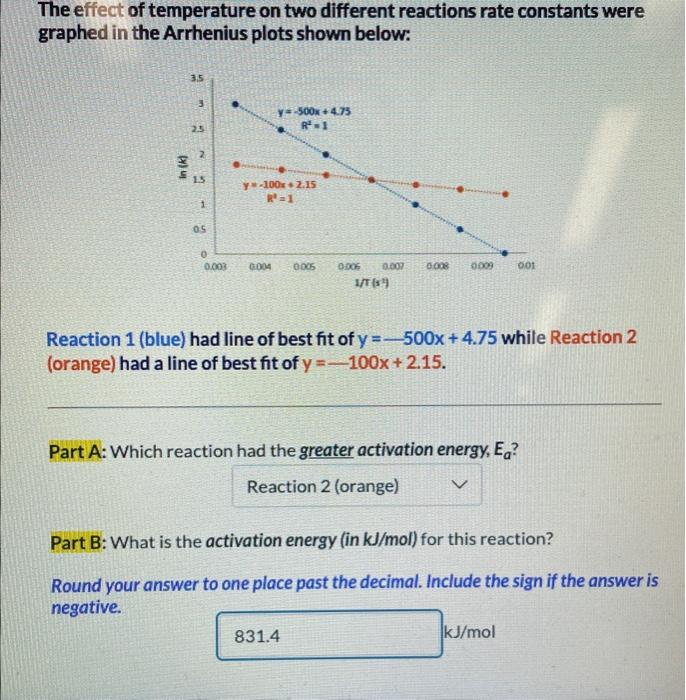
please someone help me to answer part b The effect of temperature on two different reactions rate constants were graphed in the Arrhenius plots shown
please someone help me to answer part b 

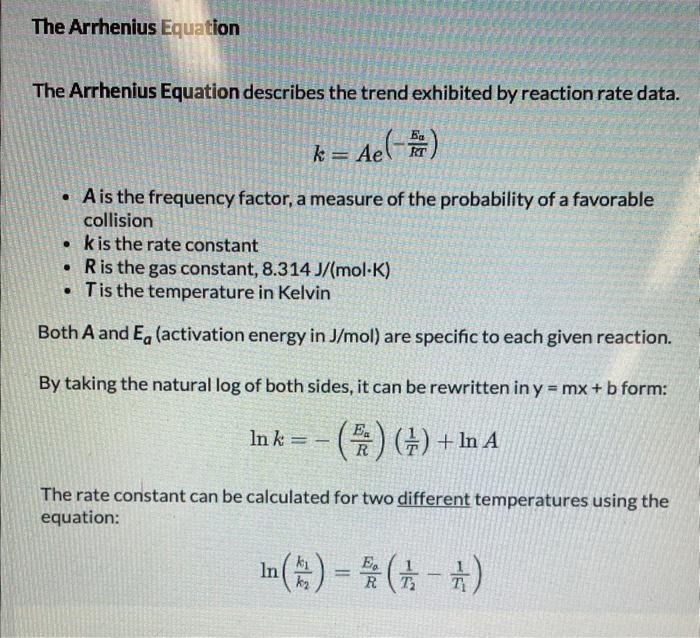
The effect of temperature on two different reactions rate constants were graphed in the Arrhenius plots shown below: Reaction 1 (blue) had line of best fit of y=500x+4.75 while Reaction 2 (orange) had a line of best fit of y=100x+2.15. Part A: Which reaction had the greater activation energy, Ea ? Part B: What is the activation energy (in kJ/mol ) for this reaction? Round your answer to one place past the decimal. Include the sign if the answer is negative. The Arrhenius Equation The Arrhenius Equation describes the trend exhibited by reaction rate data. k=Ae(RTEa) - A is the frequency factor, a measure of the probability of a favorable collision - k is the rate constant - R is the gas constant, 8.314J/(molK) - T is the temperature in Kelvin Both A and Ea (activation energy in J/mol ) are specific to each given reaction. By taking the natural log of both sides, it can be rewritten in y=mx+b form: lnk=(REa)(T1)+lnA The rate constant can be calculated for two different temperatures using the equation: ln(k2k1)=REa(T21T11) 

Step by Step Solution
There are 3 Steps involved in it
Step: 1

Get Instant Access to Expert-Tailored Solutions
See step-by-step solutions with expert insights and AI powered tools for academic success
Step: 2

Step: 3

Ace Your Homework with AI
Get the answers you need in no time with our AI-driven, step-by-step assistance
Get Started


