Answered step by step
Verified Expert Solution
Question
1 Approved Answer
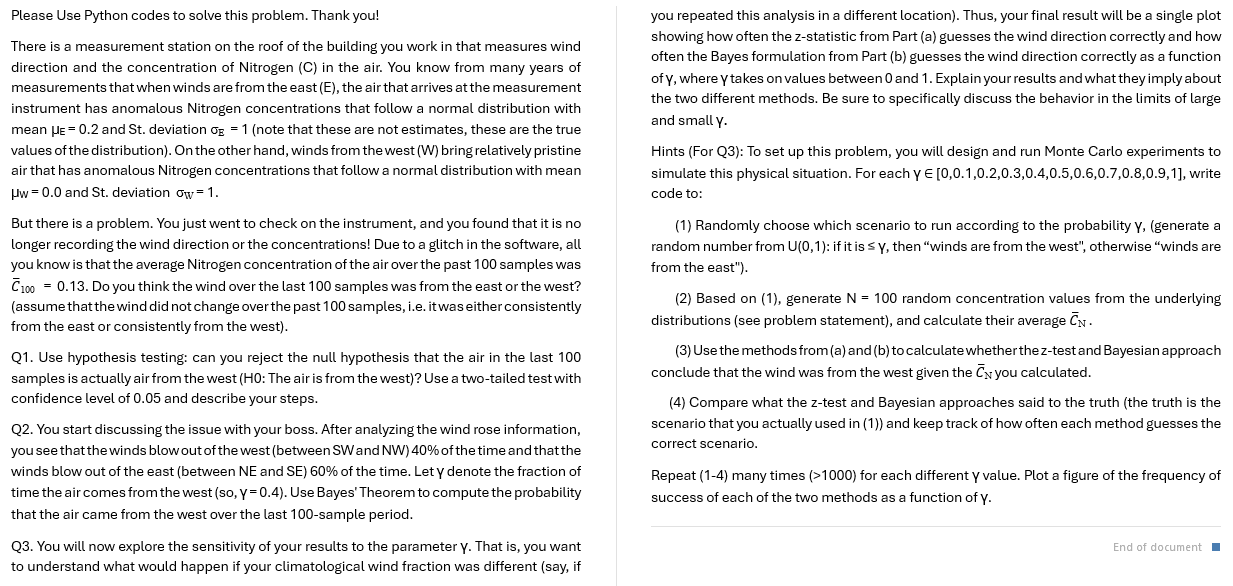
Please Use Python codes to solve this problem. Thank you! There is a measurement station on the roof of the building you work in that
Please Use Python codes to solve this problem. Thank you!
There is a measurement station on the roof of the building you work in that measures wind
direction and the concentration of Nitrogen C in the air. You know from many years of
measurements that when winds are from the east the air that arrives at the measurement
instrument has anomalous Nitrogen concentrations that follow a normal distribution with
mean and St deviation note that these are not estimates, these are the true
values of the distribution On the other hand, winds from the west W bring relatively pristine
air that has anomalous Nitrogen concentrations that follow a normal distribution with mean
and St deviation
But there is a problem. You just went to check on the instrument, and you found that it is no
longer recording the wind direction or the concentrations! Due to a glitch in the software, all
you know is that the average Nitrogen concentration of the air over the past samples was
Do you think the wind over the last samples was from the east or the west?
assume that the wind did not change over the past samples, ie it was either consistently
from the east or consistently from the west
Q Use hypothesis testing: can you reject the null hypothesis that the air in the last
samples is actually air from the west : The air is from the west Use a twotailed test with
confidence level of and describe your steps.
Q You start discussing the issue with your boss. After analyzing the wind rose information,
you see that the winds blow out of the west between SW and NW of the time and that the
winds blow out of the east between NE and SE of the time. Let denote the fraction of
time the air comes from the west so Use Bayes' Theorem to compute the probability
that the air came from the west over the last sample period.
Q You will now explore the sensitivity of your results to the parameter That is you want
to understand what would happen if your climatological wind fraction was different say if
you repeated this analysis in a different location Thus, your final result will be a single plot
showing how often the zstatistic from Part a guesses the wind direction correctly and how
often the Bayes formulation from Part b guesses the wind direction correctly as a function
of where takes on values between and Explain your results and what they imply about
the two different methods. Be sure to specifically discuss the behavior in the limits of large
and small
Hints For Q: To set up this problem, you will design and run Monte Carlo experiments to
simulate this physical situation. For each write
code to:
Randomly choose which scenario to run according to the probability generate a
random number from : if it is then "winds are from the west", otherwise "winds are
from the east"
Based on generate random concentration values from the underlying
distributions see problem statement and calculate their average
Use the methods from a and b to calculate whether the ztest and Bayesian approach
conclude that the wind was from the west given the you calculated.
Compare what the ztest and Bayesian approaches said to the truth the truth is the
scenario that you actually used in and keep track of how often each method guesses the
correct scenario.
Repeat many times for each different value. Plot a figure of the frequency of
success of each of the two methods as a function of

Step by Step Solution
There are 3 Steps involved in it
Step: 1

Get Instant Access to Expert-Tailored Solutions
See step-by-step solutions with expert insights and AI powered tools for academic success
Step: 2

Step: 3

Ace Your Homework with AI
Get the answers you need in no time with our AI-driven, step-by-step assistance
Get Started


