

Answered step by step
Verified Expert Solution
Question
1 Approved Answer
please use R code to provide all codes for question2a 2b 2c and 2dthanks library(rworldmap) ** Loading required package: ap ## ### Welcome to ruorldmap
please use R code to provide all codes for question2a 2b 2c and 2dthanks 
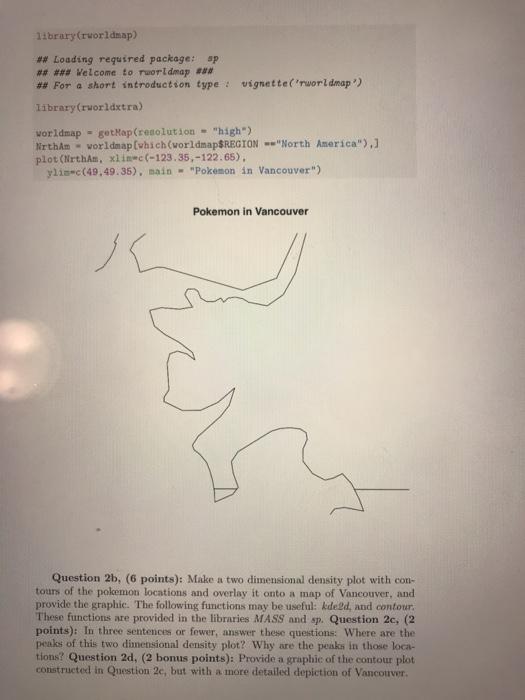
library(rworldmap) ** Loading required package: ap ## ### Welcome to ruorldmap *** ## For a short introduction type : vignette('rworldmap) library(rworldxtra) worldmap = getMap (resolution - "high") Nrtham - worldmap (which (worldmapSREGION --"North America").] plot (Nrtham, xlim c(-123.35,-122.65). ylia-c(49,49.35), main - "Pokemon in Vancouver") Pokemon in Vancouver Question 2b. (6 points): Make a two dimensional density plot with con- tours of the polemon locations and overlay it onto a map of Vancouver, and provide the graphic. The following functions may be useful: kde2d, and contour. These functions are provided in the libraries MASS and sp. Question 2c, (2 points): In three sentences or fower, answer these questions: Where are the peaks of this two dimensional density plot? Why are the peaks in those loca- tions? Question 2d, (2 bonus points): Provide a graphic of the contour plot constructed in Question 2c, but with a more detailed depiction of Vancouver Question 2a, (4 points): Plot the locations of all of the pokemon in the Vanpoke table provided in the previous lab, overlayed on a map of Vancouver. Provide the resulting graphic. The following code segment may be useful: library(rworldmap) ** Loading required package: ap ## ### Welcome to ruorldmap *** ## For a short introduction type : vignette('rworldmap) library(rworldxtra) worldmap = getMap (resolution - "high") Nrtham - worldmap (which (worldmapSREGION --"North America").] plot (Nrtham, xlim c(-123.35,-122.65). ylia-c(49,49.35), main - "Pokemon in Vancouver") Pokemon in Vancouver Question 2b. (6 points): Make a two dimensional density plot with con- tours of the polemon locations and overlay it onto a map of Vancouver, and provide the graphic. The following functions may be useful: kde2d, and contour. These functions are provided in the libraries MASS and sp. Question 2c, (2 points): In three sentences or fower, answer these questions: Where are the peaks of this two dimensional density plot? Why are the peaks in those loca- tions? Question 2d, (2 bonus points): Provide a graphic of the contour plot constructed in Question 2c, but with a more detailed depiction of Vancouver Question 2a, (4 points): Plot the locations of all of the pokemon in the Vanpoke table provided in the previous lab, overlayed on a map of Vancouver. Provide the resulting graphic. The following code segment may be useful Step by Step Solution
There are 3 Steps involved in it
Step: 1

Get Instant Access to Expert-Tailored Solutions
See step-by-step solutions with expert insights and AI powered tools for academic success
Step: 2

Step: 3
Ace Your Homework with AI
Get the answers you need in no time with our AI-driven, step-by-step assistance
Get Started
Data And Databases
Authors: Jeff Mapua
1st Edition
1978502257, 978-1978502253