Answered step by step
Verified Expert Solution
Link Copied!

Question

1 Approved Answer

Please use the two graphs, KC Covid 19 cases and KC Covid 19 deaths, to answer the following questions. What is the overall message/story that

Please use the two graphs, KC Covid 19 cases and KC Covid 19 deaths, to answer the following questions.

image text in transcribedimage text in transcribed

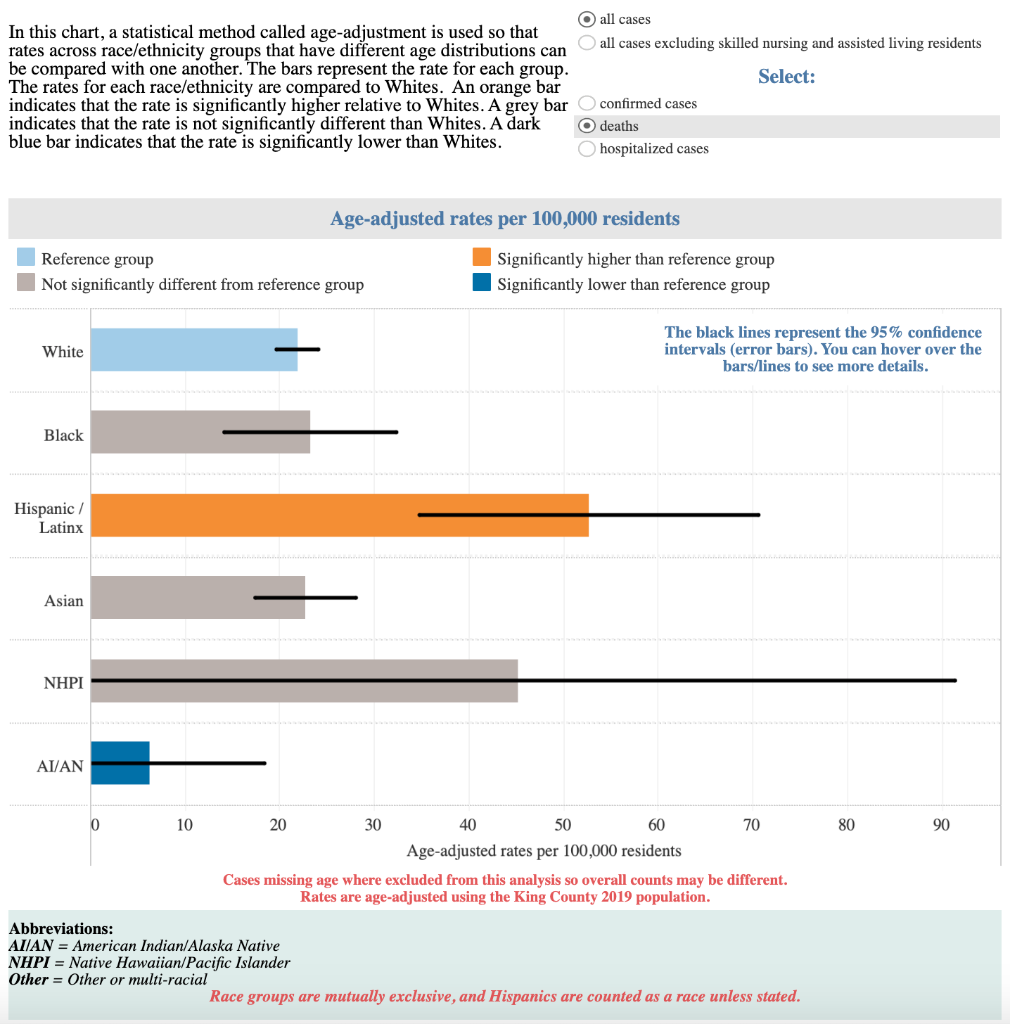
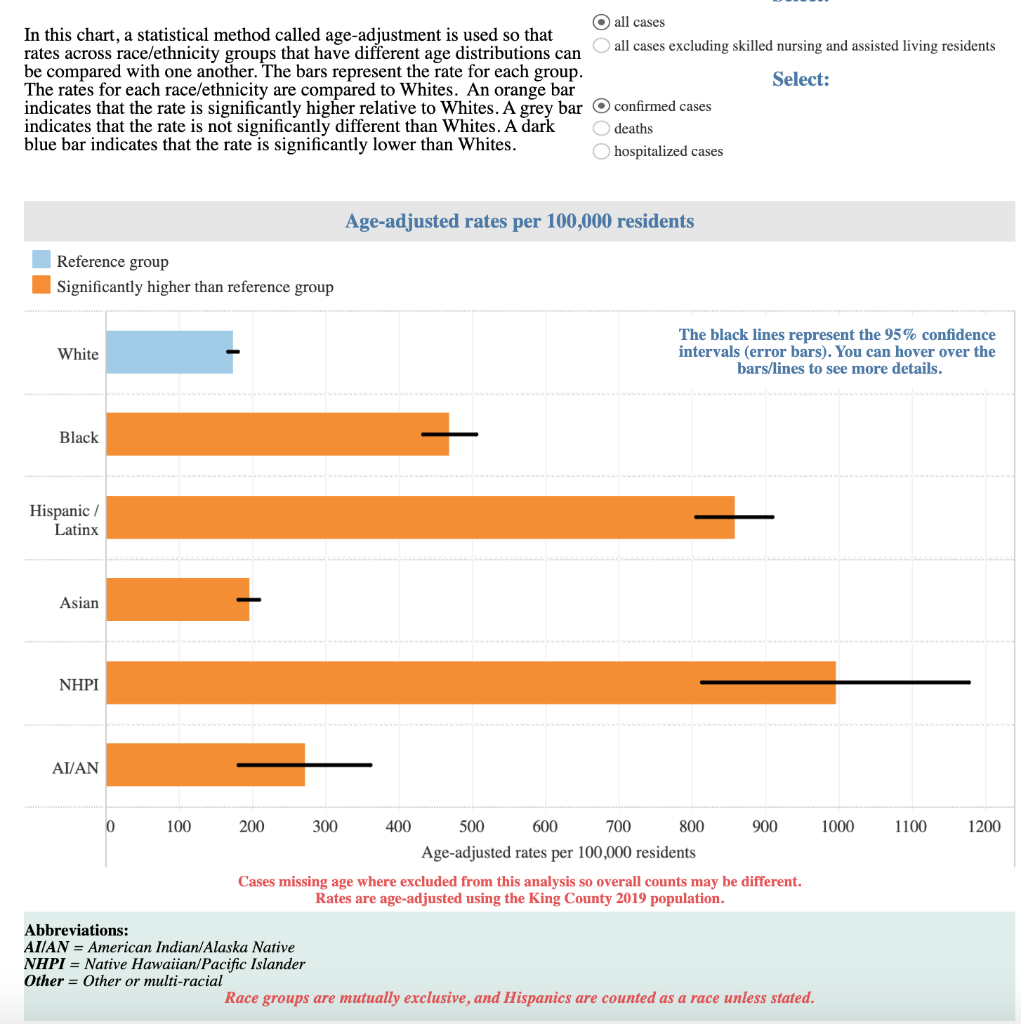
  1. What is the overall message/story that these graphs collectively depict about the cases and deaths from COVID-19 in King County? (2 points)
  2. In both COVID-19 cases and deaths data in King County, which race/ethnic group have the most accuracy in its estimate and which race/ethnic group have the least accuracy in its estimate? (2 points)
all cases In this chart, a statistical method called age-adjustment is used so that rates across race/ethnicity groups that have different age distributions can all cases excluding skilled nursing and assisted living residents be compared with one another. The bars represent the rate for each group. Select: The rates for each race/ethnicity are compared to Whites. An orange bar indicates that the rate is significantly higher relative to Whites. A grey bar confirmed cases indicates that the rate is not significantly different than Whites. A dark O deaths blue bar indicates that the rate is significantly lower than Whites. hospitalized cases Age-adjusted rates per 100,000 residents Reference group Significantly higher than reference group Significantly lower than reference group Not significantly different from reference group White The black lines represent the 95% confidence intervals (error bars). You can hover over the bars/lines to see more details. Black Hispanic / Latinx Asian NHPI AIAN 80 90 0 10 20 30 40 50 60 70 Age-adjusted rates per 100,000 residents Cases missing age where excluded from this analysis so overall counts may be different. Rates are age-adjusted using the King County 2019 population. Abbreviations: AIIAN = American Indian/Alaska Native NHPI = Native Hawaiian/Pacific Islander Other = Other or multi-racial Race groups are mutually exclusive, and Hispanics are counted as a race unless stated. O all cases In this chart, a statistical method called age-adjustment is used so that rates across race/ethnicity groups that have different age distributions can all cases excluding skilled nursing and assisted living residents be compared with one another. The bars represent the rate for each group. Select: The rates for each race/ethnicity are compared to Whites. An orange bar indicates that the rate is significantly higher relative to Whites. A grey bar O confirmed cases indicates that the rate is not significantly different than Whites. A dark deaths blue bar indicates that the rate is significantly lower than Whites. hospitalized cases Age-adjusted rates per 100,000 residents Reference group Significantly higher than reference group White The black lines represent the 95% confidence intervals (error bars). You can hover over the bars/lines to see more details. Black Hispanic / Latinx Asian NHPI AI/AN 0 100 1000 1100 1200 200 300 400 500 600 700 800 900 Age-adjusted rates per 100,000 residents Cases missing age where excluded from this analysis so overall counts may be different. Rates are age-adjusted using the King County 2019 population. Abbreviations: AIIAN = American Indian/Alaska Native NHPI = Native Hawaiian/Pacific Islander Other = Other or multi-racial Race groups are mutually exclusive, and Hispanics are counted as a race unless stated. all cases In this chart, a statistical method called age-adjustment is used so that rates across race/ethnicity groups that have different age distributions can all cases excluding skilled nursing and assisted living residents be compared with one another. The bars represent the rate for each group. Select: The rates for each race/ethnicity are compared to Whites. An orange bar indicates that the rate is significantly higher relative to Whites. A grey bar confirmed cases indicates that the rate is not significantly different than Whites. A dark O deaths blue bar indicates that the rate is significantly lower than Whites. hospitalized cases Age-adjusted rates per 100,000 residents Reference group Significantly higher than reference group Significantly lower than reference group Not significantly different from reference group White The black lines represent the 95% confidence intervals (error bars). You can hover over the bars/lines to see more details. Black Hispanic / Latinx Asian NHPI AIAN 80 90 0 10 20 30 40 50 60 70 Age-adjusted rates per 100,000 residents Cases missing age where excluded from this analysis so overall counts may be different. Rates are age-adjusted using the King County 2019 population. Abbreviations: AIIAN = American Indian/Alaska Native NHPI = Native Hawaiian/Pacific Islander Other = Other or multi-racial Race groups are mutually exclusive, and Hispanics are counted as a race unless stated. O all cases In this chart, a statistical method called age-adjustment is used so that rates across race/ethnicity groups that have different age distributions can all cases excluding skilled nursing and assisted living residents be compared with one another. The bars represent the rate for each group. Select: The rates for each race/ethnicity are compared to Whites. An orange bar indicates that the rate is significantly higher relative to Whites. A grey bar O confirmed cases indicates that the rate is not significantly different than Whites. A dark deaths blue bar indicates that the rate is significantly lower than Whites. hospitalized cases Age-adjusted rates per 100,000 residents Reference group Significantly higher than reference group White The black lines represent the 95% confidence intervals (error bars). You can hover over the bars/lines to see more details. Black Hispanic / Latinx Asian NHPI AI/AN 0 100 1000 1100 1200 200 300 400 500 600 700 800 900 Age-adjusted rates per 100,000 residents Cases missing age where excluded from this analysis so overall counts may be different. Rates are age-adjusted using the King County 2019 population. Abbreviations: AIIAN = American Indian/Alaska Native NHPI = Native Hawaiian/Pacific Islander Other = Other or multi-racial Race groups are mutually exclusive, and Hispanics are counted as a race unless stated

Step by Step Solution

There are 3 Steps involved in it

Step: 1

blur-text-image

Get Instant Access to Expert-Tailored Solutions

See step-by-step solutions with expert insights and AI powered tools for academic success

Step: 2

blur-text-image

Step: 3

blur-text-image

Ace Your Homework with AI

Get the answers you need in no time with our AI-driven, step-by-step assistance

Get Started

Recommended Textbook for

New Approach To Financial Accounting No Need Of Cramming Formats

Authors: Samuel A. Olowoniyi ACA

1st Edition

148253150X, 978-1482531503

More Books

Students also viewed these Accounting questions

Question

Subtract: (-18-25i) (1721) difference =

Answered: 1 week ago