Please write and write up comparing and contrasting the financial analysis of the companies JCPenney and Kohls. I will post the statements below. Please include:
- Sales growth in terms of percentage of increase and the numbers of stores. If you are reading the annual report, are either of the two companies adding product lines?
- Look at profitability treads for gross profit, operating profit, and net income. How is the profitability changing between the two companies?
- Since these are large retail stores, what is the trend in inventory growth? Are the growing the inventory are can the accommodate the sales increases with about the current amount of inventory on hand? Please compare their inventory efficiency with the inventory turnover ratios for each company.
- How are the companies handling their long-term debt? What have been the debt to equity ratios in the last five years? Can you tell what has been acquired with the additional debt, if there is any?
- Lastly, lets see what the stock market thinks of each companys performance. In what range has their share price been trading in the last five years? How has the Price to Earnings (P/E) ratio been during that time?
- What has taken place with each of these companies since the Annual Statement date? Search for new releases and other business articles and publications about each company.
Please follow this format:
Sales Growth Are Net Sales Growing? Are there any divisions or product lines growing? Does the annual report indicate the reason(s) for this? Does your directional analysis (horizontal or vertical) bear this out? Can we see the sales increase in the inventory turnover ratio?
Cost Control are expenses in line with the change in net sales? Look at the costs, including the cost of goods sold, marketing expenses, and administrative expenses. Look at the COGS% change and the SGA% (selling, general & administrative expenses) changes. Again, support your observation with your directional analysis and/or ratios, Profitability Look at the three levels of profits: gross margin, operating profit, and net income. How are they changing from year to year as a percentage of sales (vertical analysis)?
Cash Flow and Liquidity - Is cash increasing or decreasing. Does that make sense in light of the profits? What about the liquidity ratios? Did you find a change in the current or the quick ratio? Look at the cash flow statements. Are operations generating or consuming cash? Is the growth of inventory reasonable as compared to the growth in cost of goods sold? Look at the accounts payable turnover ratio. And dont forget about accounts receivable and their change. Are you concerned with changes in the accounts receivable turnover ratio? Debt Levels Is debt increasing or decreasing? Looks at the change in current and long-term liabilities in your directional analyses. What are the reasons for this change? Look at your debt ratios. Is there anything in the annual report or outside articles to explain a significant change in debt, if you find one?
Equity and Stock Market Factors Has common stock plus the paid-in capital on common stock increased? Has it decreased from a buyback of common stock (treasury stock)? What about the price of the stock, has it changed significantly over the years of your analysis. Look at the price to earnings ratio and the dividend yield ratio.
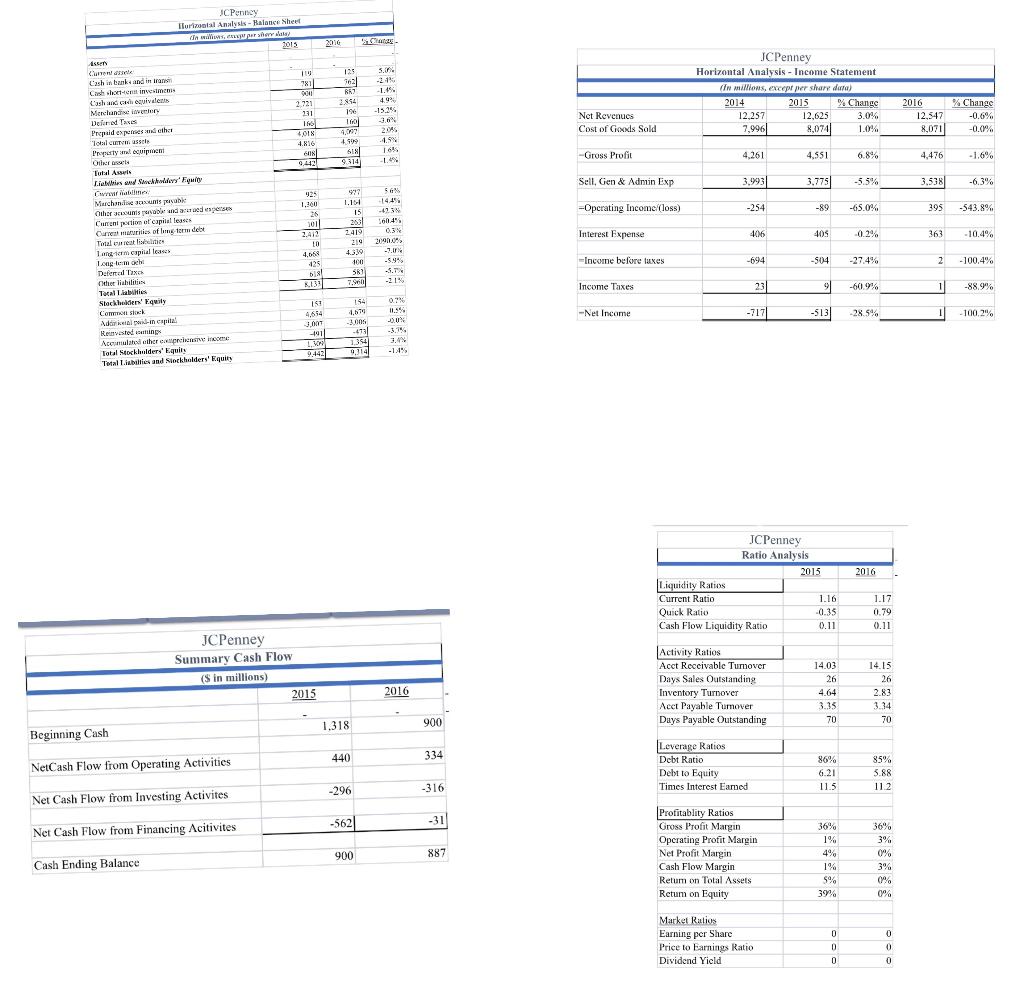
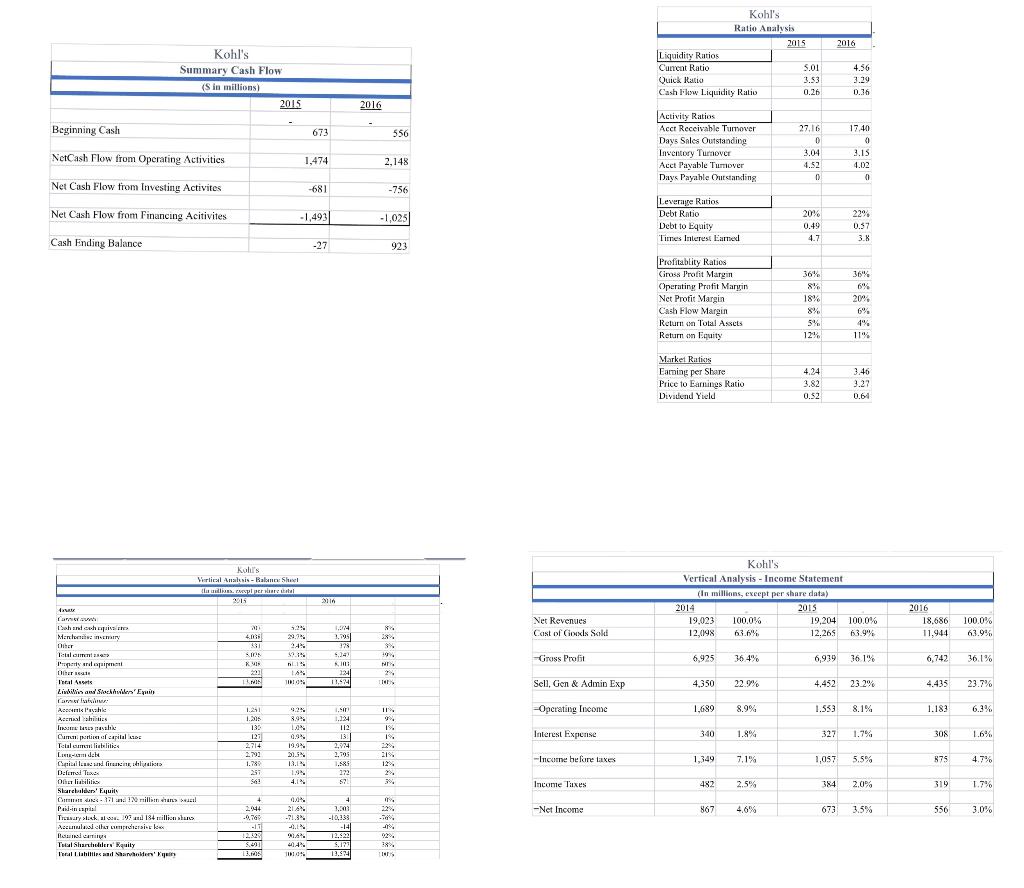
2016 Care S. -21% -1.49 4.9% -15.25 -3.5 2.046 1.99 1655 JC Penney Horizontal Analysis - Income Statement (in millions, except we share dar) 2014 2015 % Change 12,257 12,625 3.9% 7,996 8,074 1.0% 2016 12.547 Nct Revenues Cost of Goods Sold % Change % -0.6% -0.0% 8.071 -Gross Profit 4.261 4.551 6.8% 4.476 -1.6% Sell. Cien & Admin Exp 3.993 3.775 -5.5% 3.538 -6.3% JC Penny Turizontal Analysis - Balance Nheel m hani 2013 ASS Currenak 114 Cash in banks and in irans Cashottont investment 9041 L'ash and conseguivalent Mercury 2.721 211 Defined his Prepaid expones de che CINTA 4018 4.816 Irurly raleguipman OIRE Tull Awards 0,442 Lielis Sandry Equity worlama Muchandoxunsavak 425 Other counsel and as speses 1.300 26 Current portion of capital leases Current mais of metode 1011 Tocal creatitis 2.412 Lan-e capital case Lagen och 4.658 Date Tax 425 Other liabilities Tocal labies K.131 Stockholders' Equity Comorsk Adici in capital Revested in Acested other expre -4911 Total Stockholders' Equins Tvaliswillies and stockholders' Equity -254 -Operating Income loss) -89 -65.0% 395 1727597 ******** 99FFF). -543.8%. 56 14.45 -411 560.4% 0.3% % 209.0 -J. -5.9% -3.7% -21% Interest Expense 406 405 0.2% 363 -10.4% -Income before luxes -694 -504 -27.4% 2 -100.4% Income Taxes 23 91 -609% 1 -88.9% 07 11.54 4.654 -Net Income -7171 -5131 -28.5% -100.21% -3.75 3.0 -1.4% 2016 JCPenney Ratio Analysis 2015 Liquidity Ratios Current Ratio 1.16 Quick Ratio -0.35 Cash Flow Liquidity Ratio 0.11 1.17 0.79 0.11 JCPenney Summary Cash Flow (S in millions) 2015 2016 Activity Ratios Acct Receivable Tumover Days Sales Outstanding Inventory Turnover Acct Payable Tumover Days Payable Outstanding 14.03 26 4.64 3.35 70 14.15 26 2.83 3.34 70 1,318 900 Beginning Cash 440 334 NetCash Flow from Operating Activities Leverage Ratios Debt Ratio Debt to Equity Times Interest Eamed 86% 6.21 11.5 85% 5.88 112 -296 -316 Net Cash Flow from Investing Activites -562 -31 36% Net Cash Flow from Financing Acitivites 36% 3% 900 887 Profitablity Ratios Gross Profit Margin Operating Prott Margin Net Profit Margin Cash Flow Margin Retum on Total Assets Retum on Equity Cash Ending Balance 4% 1% 1 5% 39% 0% 3% 0% 0% 0 Market Ralios Earning per Share Price to Earnings Ratio Dividend Yield D 0 0 0 0 0 2016 Kohl's Summary Cash Flow (Sin millions) 2015 Kohl's Ratio Analysis 2015 Liquidity Ratios Current Ratic 5.01 Quick Ratio 3.53 Cash Flow Liquidity Ratio 0.26 4.56 3.19 0.36 2016 Beginning Cash 673 556 Activity Ratios Acct Receivable Tumover Days Sales Outstanding Inventory Turnover Acct Payable Tumover Days Payable Outstanding NetCash Flow from Operating Activities 27.16 0 3,04 4.52 D 17.40 0 3.15 4.02 0 1,474 2,148 Net Cash Flow from Investing Activites -681 -756 Net Cash Flow from Financing Acitivites -1,493 -1,025 Leverage Ratios Debt Ratio Debt to Equity Tires Interest Eml 20% 0.49 4.7 229 0.37 3.8 Cash Ending Balance -27 923 Profitablity Ratios Giross Profit Margin Operating Profit Maryin Net Profit Margin Cash Flow Margin Return on Total Assets Return on Equity 36% 8% 18% 8% 5% 12% 36% 69 20% 6% 4% 11% Market Ratis Earning per Share Price to Earnings Ratio Diviuund Yield 4.24 3.82 0.52 3.46 3.27 0.64 koli's Verlis Anakis - Balance Shuel la reperareal 2015 Kohl's Vertical Analysis - Income Statement (in millinns, exeept per share data) 2014 2015 19.023 100.0% 19,204 100.0% 12.0198 63.6% 12.265 63.9% AVRU 2016 18.686 11,944 21 1.1. Net Revenues Cast of Goxls Sale Dance Meny Diber 100.0% 63.9% 1:44 1.295 128 614 54 981 SITE RI 844 28% $% 19 NY 24 110 Gross Profit 6,925 36.4% 6,979 36 1% 6,742 36.1% ni 149 1841 11.5741 I! Sell, Gen & Admin Exp 4,350 22.01 4.452 23.29 4.435 23.7% Operating Income 1.689 8.9% Ir 9 1.533 8.1% 1.183 Interest Expense 340 1.8% 1.7% 327 30% 16% Property are paiement DET Incal Asus Lindiwis and Stechwyt Camer Arnis Pecah Asendah hits It has the Cum portals Total Clielile LINEA dale (urital la url liru Alaits Delemod Texex Ofeliability Sarebilers' Equils Care 11 million chans al Pail.in anpil Tresary lack and 184 millions 1.251 1.31 133 127 2714 27 1.13 257 56. 1.4 0.94 19.9% 3.5% 13.1 1.91 4.1% 1.9 1.124 112 13 2,914 2,795 1.583 272 57 24 -Income here lakes 1,349 7,1% 1.057 5.5% 4.7% 2 . Income Taxes 482 2.5% 384 2.0% 319 1.7% -Net Income 867 4,6% 673 3.5% 556 3.0% + + 2944 -2.76 -17 12.30 216 -71.34 -0.14 21.6. 04 TI 4 11% 1,500 329 -10,133 -0% -141 % 12.5221 9.1784 13.9741 TES RTV Total Shamblers' Rquity la Llahillies haven' 2016 Care S. -21% -1.49 4.9% -15.25 -3.5 2.046 1.99 1655 JC Penney Horizontal Analysis - Income Statement (in millions, except we share dar) 2014 2015 % Change 12,257 12,625 3.9% 7,996 8,074 1.0% 2016 12.547 Nct Revenues Cost of Goods Sold % Change % -0.6% -0.0% 8.071 -Gross Profit 4.261 4.551 6.8% 4.476 -1.6% Sell. Cien & Admin Exp 3.993 3.775 -5.5% 3.538 -6.3% JC Penny Turizontal Analysis - Balance Nheel m hani 2013 ASS Currenak 114 Cash in banks and in irans Cashottont investment 9041 L'ash and conseguivalent Mercury 2.721 211 Defined his Prepaid expones de che CINTA 4018 4.816 Irurly raleguipman OIRE Tull Awards 0,442 Lielis Sandry Equity worlama Muchandoxunsavak 425 Other counsel and as speses 1.300 26 Current portion of capital leases Current mais of metode 1011 Tocal creatitis 2.412 Lan-e capital case Lagen och 4.658 Date Tax 425 Other liabilities Tocal labies K.131 Stockholders' Equity Comorsk Adici in capital Revested in Acested other expre -4911 Total Stockholders' Equins Tvaliswillies and stockholders' Equity -254 -Operating Income loss) -89 -65.0% 395 1727597 ******** 99FFF). -543.8%. 56 14.45 -411 560.4% 0.3% % 209.0 -J. -5.9% -3.7% -21% Interest Expense 406 405 0.2% 363 -10.4% -Income before luxes -694 -504 -27.4% 2 -100.4% Income Taxes 23 91 -609% 1 -88.9% 07 11.54 4.654 -Net Income -7171 -5131 -28.5% -100.21% -3.75 3.0 -1.4% 2016 JCPenney Ratio Analysis 2015 Liquidity Ratios Current Ratio 1.16 Quick Ratio -0.35 Cash Flow Liquidity Ratio 0.11 1.17 0.79 0.11 JCPenney Summary Cash Flow (S in millions) 2015 2016 Activity Ratios Acct Receivable Tumover Days Sales Outstanding Inventory Turnover Acct Payable Tumover Days Payable Outstanding 14.03 26 4.64 3.35 70 14.15 26 2.83 3.34 70 1,318 900 Beginning Cash 440 334 NetCash Flow from Operating Activities Leverage Ratios Debt Ratio Debt to Equity Times Interest Eamed 86% 6.21 11.5 85% 5.88 112 -296 -316 Net Cash Flow from Investing Activites -562 -31 36% Net Cash Flow from Financing Acitivites 36% 3% 900 887 Profitablity Ratios Gross Profit Margin Operating Prott Margin Net Profit Margin Cash Flow Margin Retum on Total Assets Retum on Equity Cash Ending Balance 4% 1% 1 5% 39% 0% 3% 0% 0% 0 Market Ralios Earning per Share Price to Earnings Ratio Dividend Yield D 0 0 0 0 0 2016 Kohl's Summary Cash Flow (Sin millions) 2015 Kohl's Ratio Analysis 2015 Liquidity Ratios Current Ratic 5.01 Quick Ratio 3.53 Cash Flow Liquidity Ratio 0.26 4.56 3.19 0.36 2016 Beginning Cash 673 556 Activity Ratios Acct Receivable Tumover Days Sales Outstanding Inventory Turnover Acct Payable Tumover Days Payable Outstanding NetCash Flow from Operating Activities 27.16 0 3,04 4.52 D 17.40 0 3.15 4.02 0 1,474 2,148 Net Cash Flow from Investing Activites -681 -756 Net Cash Flow from Financing Acitivites -1,493 -1,025 Leverage Ratios Debt Ratio Debt to Equity Tires Interest Eml 20% 0.49 4.7 229 0.37 3.8 Cash Ending Balance -27 923 Profitablity Ratios Giross Profit Margin Operating Profit Maryin Net Profit Margin Cash Flow Margin Return on Total Assets Return on Equity 36% 8% 18% 8% 5% 12% 36% 69 20% 6% 4% 11% Market Ratis Earning per Share Price to Earnings Ratio Diviuund Yield 4.24 3.82 0.52 3.46 3.27 0.64 koli's Verlis Anakis - Balance Shuel la reperareal 2015 Kohl's Vertical Analysis - Income Statement (in millinns, exeept per share data) 2014 2015 19.023 100.0% 19,204 100.0% 12.0198 63.6% 12.265 63.9% AVRU 2016 18.686 11,944 21 1.1. Net Revenues Cast of Goxls Sale Dance Meny Diber 100.0% 63.9% 1:44 1.295 128 614 54 981 SITE RI 844 28% $% 19 NY 24 110 Gross Profit 6,925 36.4% 6,979 36 1% 6,742 36.1% ni 149 1841 11.5741 I! Sell, Gen & Admin Exp 4,350 22.01 4.452 23.29 4.435 23.7% Operating Income 1.689 8.9% Ir 9 1.533 8.1% 1.183 Interest Expense 340 1.8% 1.7% 327 30% 16% Property are paiement DET Incal Asus Lindiwis and Stechwyt Camer Arnis Pecah Asendah hits It has the Cum portals Total Clielile LINEA dale (urital la url liru Alaits Delemod Texex Ofeliability Sarebilers' Equils Care 11 million chans al Pail.in anpil Tresary lack and 184 millions 1.251 1.31 133 127 2714 27 1.13 257 56. 1.4 0.94 19.9% 3.5% 13.1 1.91 4.1% 1.9 1.124 112 13 2,914 2,795 1.583 272 57 24 -Income here lakes 1,349 7,1% 1.057 5.5% 4.7% 2 . Income Taxes 482 2.5% 384 2.0% 319 1.7% -Net Income 867 4,6% 673 3.5% 556 3.0% + + 2944 -2.76 -17 12.30 216 -71.34 -0.14 21.6. 04 TI 4 11% 1,500 329 -10,133 -0% -141 % 12.5221 9.1784 13.9741 TES RTV Total Shamblers' Rquity la Llahillies haven