Answered step by step
Verified Expert Solution
Question
1 Approved Answer
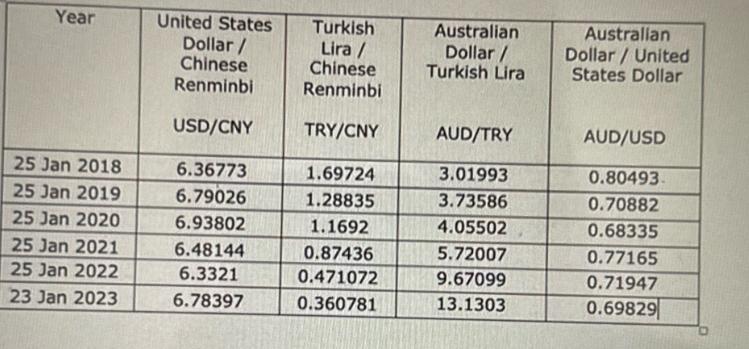
Plot the movement of the cross rates you calculated from part d) on a separate diagram. Clearly label your axes. In no more than


Plot the movement of the cross rates you calculated from part d) on a separate diagram. Clearly label your axes. In no more than approx. 100 words, briefly comment on the cross-rate diagram you have constructed i.e., are there any apparent trends/patterns/peaks/troughs etc and are there any reasons you can identify for such patterns/trends/peaks/troughs etc. Year United States Dollar/ Chinese Turkish Lira / Chinese Australian Dollar/ Turkish Lira Australian Dollar/United States Dollar Renminbi Renminbi USD/CNY TRY/CNY AUD/TRY AUD/USD 25 Jan 2018 6.36773 1.69724 3.01993 0.80493. 25 Jan 2019 6.79026 1.28835 3.73586 0.70882 25 Jan 2020 6.93802 1.1692 4.05502 0.68335 25 Jan 2021 6.48144 0.87436 5.72007 0.77165 25 Jan 2022 6.3321 0.471072 9.67099 0.71947 23 Jan 2023 6.78397 0.360781 13.1303 0.69829
Step by Step Solution
There are 3 Steps involved in it
Step: 1
Answer To plot the movement of the cross rates you can use a line graph w...
Get Instant Access to Expert-Tailored Solutions
See step-by-step solutions with expert insights and AI powered tools for academic success
Step: 2

Step: 3

Ace Your Homework with AI
Get the answers you need in no time with our AI-driven, step-by-step assistance
Get Started


