Answered step by step
Verified Expert Solution
Question
1 Approved Answer
pls answer the questions using matlab zyLab 2 - Bone compression test (1 specimen) A 7 -mm cube of bone was subjected to a compression


pls answer the questions using matlab
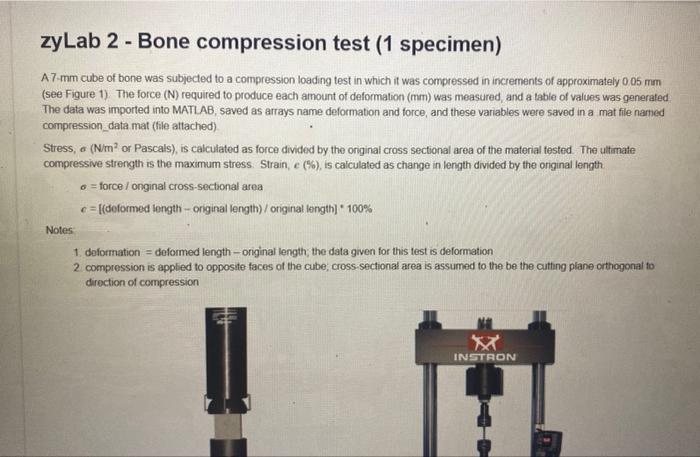
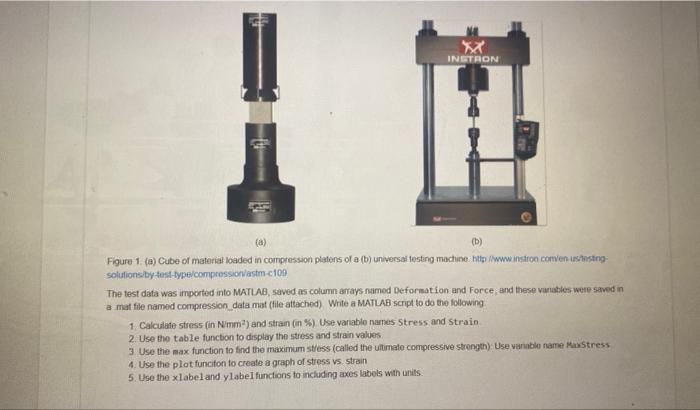
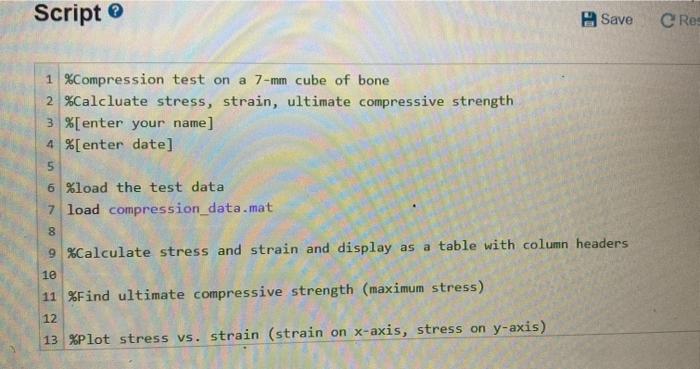
zyLab 2 - Bone compression test (1 specimen) A 7 -mm cube of bone was subjected to a compression loading test in which it was compressed in increments of approximately 0.05 mm (see Figure 1). The force (N) required to produce each amount of deformation (mm) was measured, and a table of values was generated The data was imported into MATLAB, saved as arrays name deformation and force, and these variables were saved in a mat file named compression_data mat (file attached) Stress, a (N/m or Pascals), is calculated as force divided by the original cross sectional area of the material tested. The ultimate compressive strength is the maximum stress. Strain, c(%), is calculated as change in length divided by the original length =force/onginalcross-sectionalareac=[(doformedlength-originallength)/originallength]*100% Notes 1. deformation = doformed length original length; the data given for this test is deformation 2. compression is applied to opposite faces of the cube, cross sectional area is assumed to the be the cutting plane orthogonal to drection of compression Figure 1. (a) Cube of materiak loaded in compression platens of a (b) unversai festing machine htla limuw insiron comven isslesting soludionsiby test-byelcompressiontastm cion The lest data was imponted into MATLAB, saved as column andays named Deformat ion and Force, and these vamables were saved in a mat fille named corrpression data mat (file atteched) Write a MATLAE script to do the following 1. Calculate stress (in Nmm2 ) and stran (in \%) Use variable names stress and strain 2. Use the table funcbon to display the stress and strain values. 3. Use the aax function to find the maximum stiess (called the ufirnato compressive strongth): Use variable name Manstress 4. Use the plot funciton to create a graph of stress vs strain 5. Use the x label and ylabel functions to including axes labels with units. 1 \%Compression test on a 7-mm cube of bone 2 \%Calcluate stress, strain, ultimate compressive strength \%[enter your name] 4 \%[enter date] \%load the test data load compression_data.mat \%Calculate stress and strain and display as a table with column headers \%Find ultimate compressive strength (maximum stress) Plot stress vs. Strain (strain on x-axis, stress on y-axis) Step by Step Solution
There are 3 Steps involved in it
Step: 1

Get Instant Access to Expert-Tailored Solutions
See step-by-step solutions with expert insights and AI powered tools for academic success
Step: 2

Step: 3

Ace Your Homework with AI
Get the answers you need in no time with our AI-driven, step-by-step assistance
Get Started


