Answered step by step
Verified Expert Solution
Link Copied!

Question

1 Approved Answer

Portfolio management ? Plot portfolios in mean-standard space? Suppose the monthly risk-free rate is 0.4% Add the capital market line to previous graph? From graph,

Portfolio management ? image text in transcribed
Plot portfolios in mean-standard space? Suppose the monthly risk-free rate is 0.4% Add the capital market line to previous graph? From graph, calculate the proportion of stocks in and US stock that make the tangency portfolio you are prepared to tolerate risk of 3.5 % monthly what is the highest expected monthly return you can achieve by combining swiss equation and the risk free asset? How would you achieve This portfolio. Plot portfolios in mean-standard space? Suppose the monthly risk-free rate is 0.4% Add the capital market line to previous graph? From graph, calculate the proportion of stocks in and US stock that make the tangency portfolio you are prepared to tolerate risk of 3.5 % monthly what is the highest expected monthly return you can achieve by combining swiss equation and the risk free asset? How would you achieve This portfolio

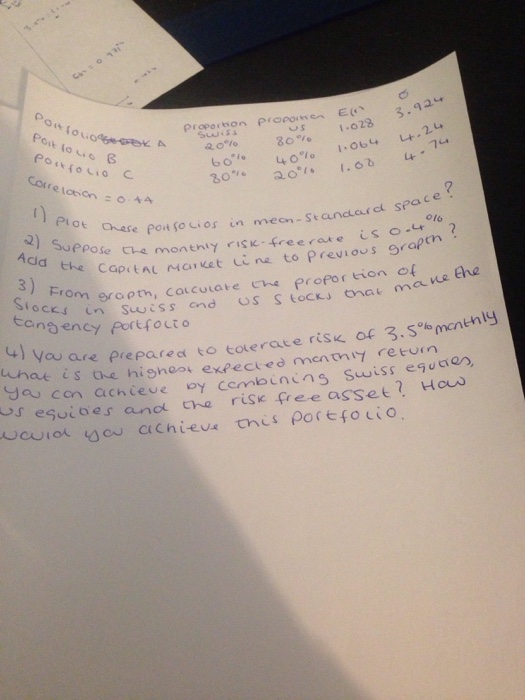
Step by Step Solution

There are 3 Steps involved in it

Step: 1

blur-text-image

Get Instant Access to Expert-Tailored Solutions

See step-by-step solutions with expert insights and AI powered tools for academic success

Step: 2

blur-text-image

Step: 3

blur-text-image

Ace Your Homework with AI

Get the answers you need in no time with our AI-driven, step-by-step assistance

Get Started

Recommended Textbook for

Managing Finance

Authors: CMI Books

1st Edition

1781252181, 978-1781252185

More Books

Students also viewed these Finance questions

Question

What is the growth rate of GDP per capita?

Answered: 1 week ago