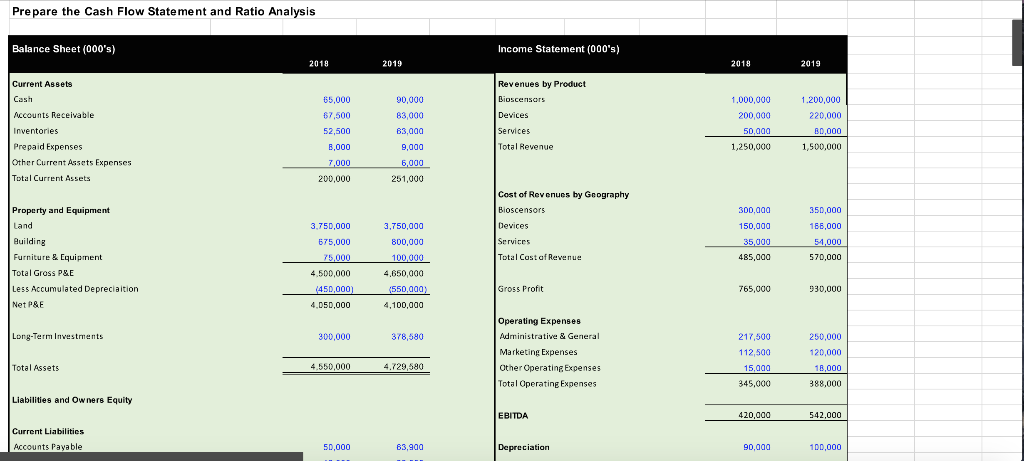
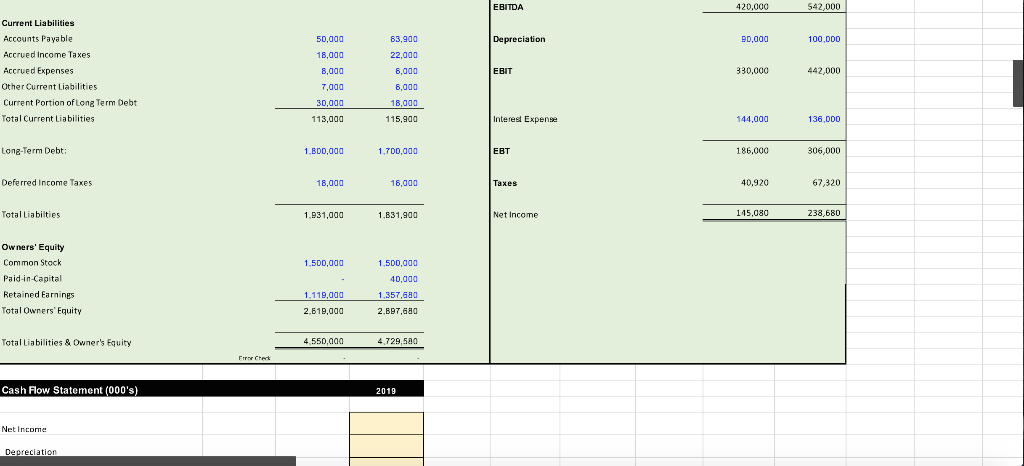
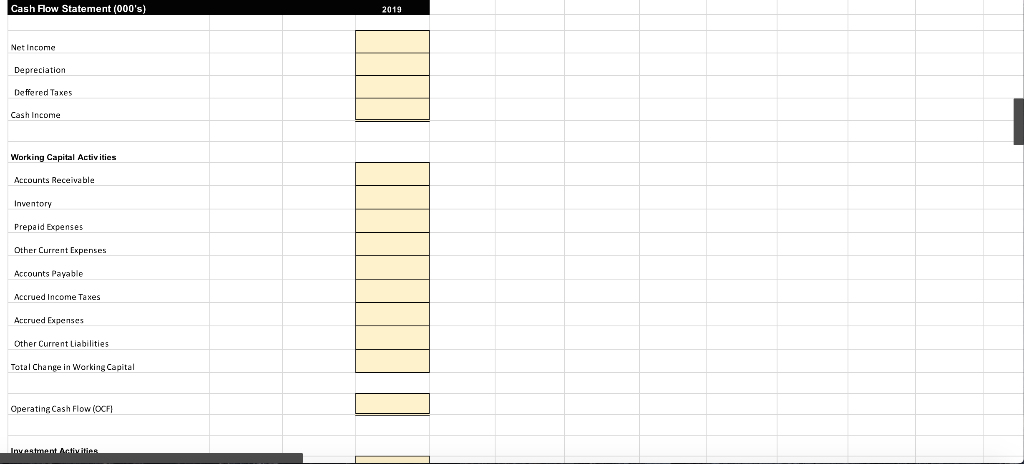
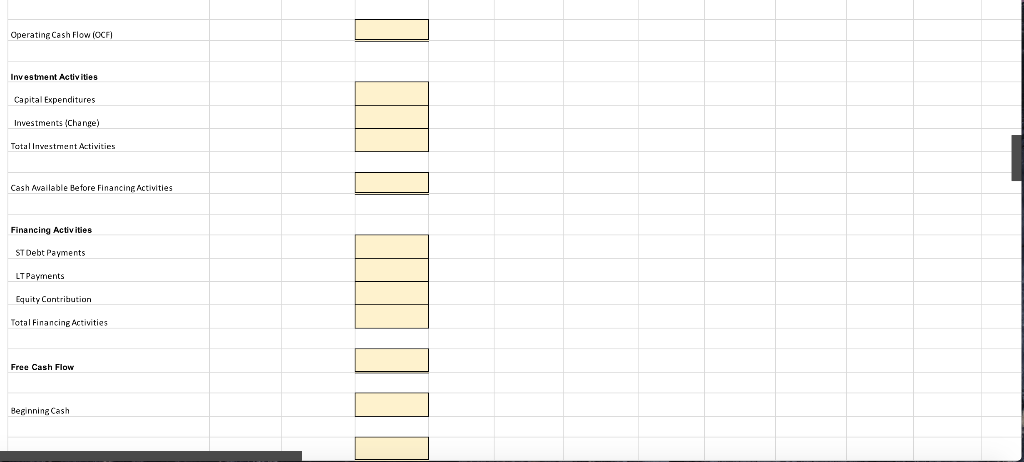
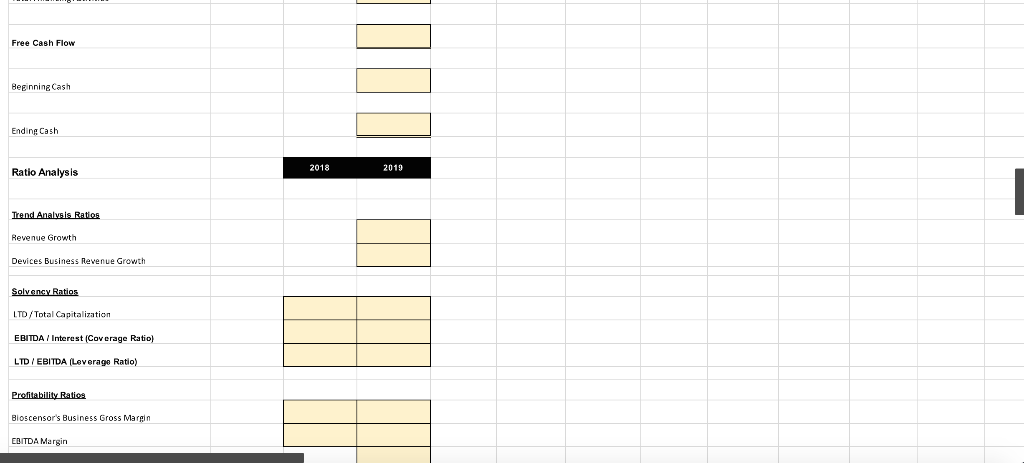
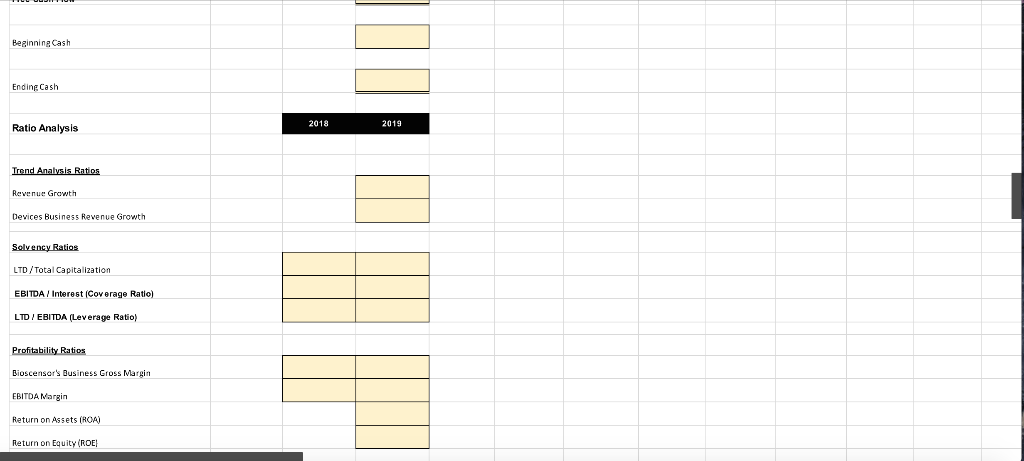
Prepare the Cash Flow Statement and Ratio Analysis Balance Sheet (000's) Income Statement (000's) 2018 2019 2018 2019 Current Assets Cash 65,000 90,000 Revenues by Product Bioscensors Devices Accounts Receivable 87,500 52,500 B,000 1,000,000 200,000 50,000 1,250,000 Inventories 1.200,000 220,000 B0,000 1,500,000 83,000 83,000 9,000 6,000 251,000 Services Prepaid Expenses Other Current Assets Expenses Total Current Assets Total Revenue 7,000 200,000 3.750.000 575,000 Property and Equipment sad Land Building Furniture & Equipment Total Gross P&E Less Accumulated Depreciation Net P&E Cost of Revenues by Geography Bioscensors Devices Services Total Cost of Revenue 300,000 150,000 35,000 485,000 350,000 165,000 54,000 570,000 75,000 3,750,000 800,000 100,000 4,650,000 550.000) 4,100,000 4.500,000 (450,000) Gross Profit 765,000 930,000 4,050,000 Long-Term Investments 300,000 378,580 Operating Expenses Administrative & General Marketing Expenses Other Operating Expenses Total Operating Expenses 217,500 112,500 15,000 345,000 250,000 120,000 18,000 388,000 Total Assets 4.550.000 4.729,580 Liabilities and Owners Equity EBITDA 420,000 542,000 Current Liabilities Accounts Payable 50,000 83,900 Depreciation 90,000 100,000 EBITDA 420,000 542,000 Depreciation 90,000 100,000 Current Liabilities Accounts Payable Accrued Income Taxes Accrued Expenses Other Current Liabilities Current Portion of Long Term Debt Total Current Liabilities 50,000 18,000 8,000 7.000 30,000 | EBIT 330.000 442,000 63.900 22,000 8,000 8,000 18,000 115,900 113,000 Interest Expense 144,000 136.DDD Long-Term Debt: 1.BDO,000 1.700,000 EBT 186,000 306,000 Deferred Income Taxes 18,000 16,000 Taxes 40.920 67,320 Total Liabilties 1.931,000 1,831,900 Net Income 145,080 238,680 1.500,000 Owners' Equity Common Stock Paid in Capital Retained Earnings Total Owners' Equity 1,500,000 40,000 1.357.680 2.897,680 1,119,000 2.619,000 Total Liabilities & Owner's Equity 4.550,000 4,729,580 Echt Cash Flow Statement (000's) 2019 Net Income Depreciation Cash Flow Statement (000's) 2019 Net Income Depreciation Deffered Taxes Cash Income Working Capital Activities Accounts Receivable Inventory Prepaid Expenses Other Current Expenses Accounts Payable Accrued Income Taxes Accrued Expenses Other Current Liabilities Total Change in Working Capital Operating Cash Flow (OCF) Investment Activities Operating Cash Flow (OCF) Investment Activities Capital Expenditures Investments (change) Total Investment Activities Cash Available Before Financing Activities Financing Activities ST Debt Payments LT Payments Equity Contribution Total Financing Activities Free Cash Flow Beginning Cash Free Cash Flow Beginning Cash Ending Cash 2018 2019 Ratio Analysis Trend Analysis Ratios Revenue Growth Devices Business Revenue Growth Solvency Ratios LTD /Total Capitalization EBITDA / Interest (Coverage Ratio) LTD / EBITDA (Leverage Ratio) Profitability Ratios Bioscensor's Business Gross Margin EBITDA Margin Beginning Cash Ending Cash 2018 2019 Ratio Analysis Trend Analysis Ratios Revenue Growth Devices Business Revenue Growth Solvency Ratios LTD /Total Capitalization EBITDA / Interest (Coverage Ratio) LID / EBITDA (Leverage Ratio) Profitability Ratios Bioscensor's Business Gross Margin EBITDA Margin Return on Assets (ROA) Return on Equity (ROEI


