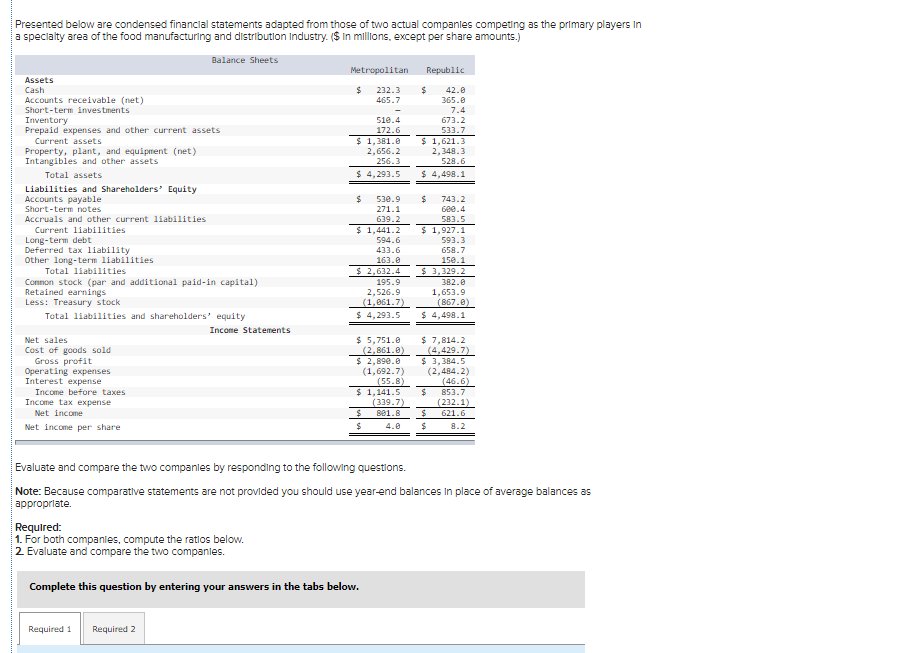
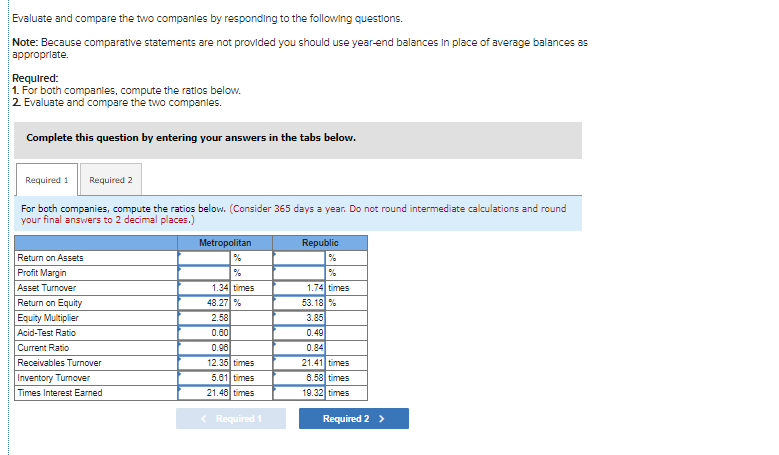
Presented below are condensed financial statements adapted from those of two actual companies competing as the primary players in a specialty area of the food manufacturing and distribution Industry. ($ in millions, except per share amounts.) Balance Sheets Metropolitan Republic $ 232.3 465.7 510.4 172.6 $ 1,381.6 2,656.2 256.3 $ 4,293.5 $ 42.8 365.6 7.4 673.2 533.7 $ 1,621.3 2,348.3 528.6 $ 4,498.1 Assets Cash Accounts receivable (net) Short-term investments Inventory Prepaid expenses and other current assets Current assets Property, plant, and equipment (net) Intangibles and other assets Total assets Liabilities and Shareholders' Equity Accounts payable Short-term notes Accruals and other current liabilities Current liabilities Long-term debt Deferred tax liability Other long-term liabilities Total liabilities Connon stock (par and additional paid-in capital) Retained earnings Less: Treasury stock Total liabilities and shareholders' equity Income Statements Net sales Cost of goods sold Gross profit Operating expenses Interest expense Income before taxes Income tax expense Net income Net income per share $ 530.9 271.1 639.2 $ 1,441.2 594.6 433.6 163.0 $ 2,632.4 195.9 2,526.9 (1.061.7) $ 4,293.5 $ 743.2 600.4 583.5 $ 1,927.1 593.3 658.7 150.1 $ 3,329.2 382.0 1,653.9 (867.8) $ 4,498.1 $ 5,751.0 (2,861.0) $ 2,890. (1,692.7) (55.8) $ 1,141.5 (339.7) 881.8 $ $ 7,814.2 (4,429.7) $ 3,384.5 (2,484.2) (46.6) $ 853.7 (232.1) 621.6 $ 8.2 Evaluate and compare the two companies by responding to the following questions. Note: Because comparative statements are not provided you should use year-end balances in place of average balances as appropriate. Required: 1. For both companies, compute the ratios below. 2 Evaluate and compare the two companies. Complete this question by entering your answers in the tabs below. Required 1 Required 2 Evaluate and compare the two companies by responding to the following questions. Note: Because comparative statements are not provided you should use year-end balances in place of average balances as appropriate. Required: 1. For both companies, compute the ratios below. 2 Evaluate and compare the two companies. Complete this question by entering your answers in the tabs below. Required 1 Required 2 For both companies, compute the ratios below. Consider 365 days a year. Do not round intermediate calculations and round your final answers to 2 decimal places.) Metropolitan Republic Return on Assets % % Profit Margin Asset Turnover 1.34 times 1.74 times Return on Equity 48.27% 53.18% Equity Multiplier 2.58 3.86 Acid-Test Ratio 0.60 0.49 Current Ratio 0.98 0.84 Receivables Turnover 12.36 times 21.41times Inventory Turnover 5.61 times 8.58 times Times Interest Earned 21.46 times 19.32 times Required Required 2 >