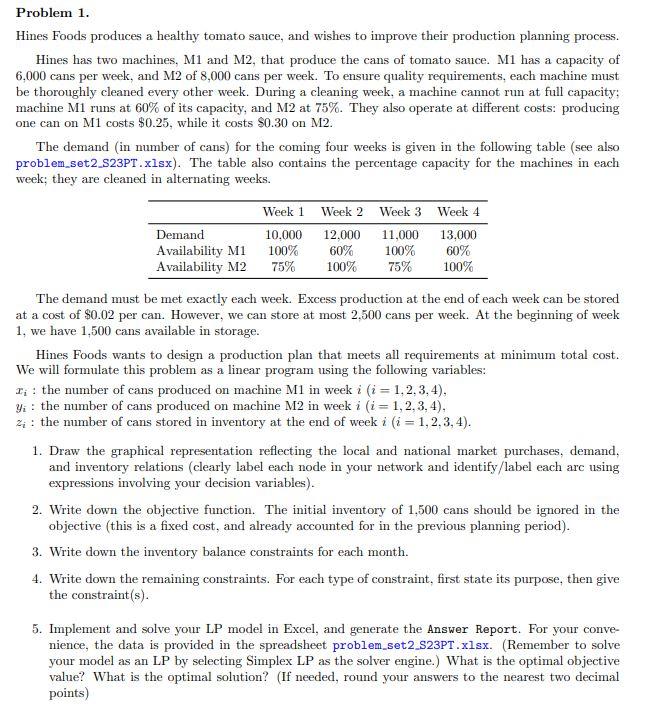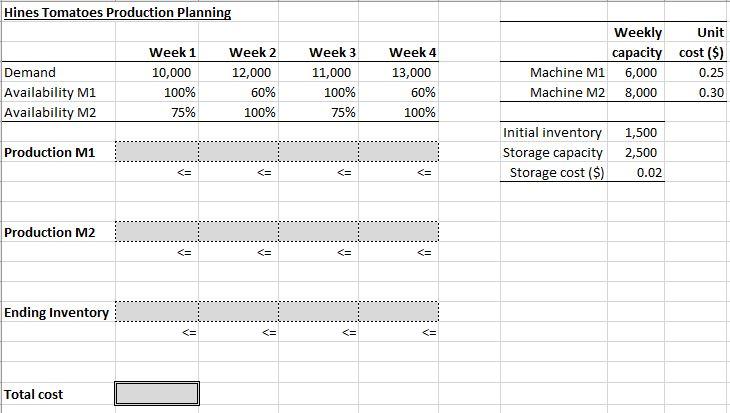

Problem 1. Hines Foods produces a healthy tomato sauce, and wishes to improve their production planning process. Hines has two machines, M1 and M2, that produce the cans of tomato sauce. M1 has a capacity of 6,000 cans per week, and M2 of 8,000 cans per week. To ensure quality requirements, each machine must be thoroughly cleaned every other week. During a cleaning week, a machine cannot run at full capacity: machine M1 runs at 60% of its capacity, and M2 at 75%. They also operate at different costs: producing one can on M1 costs $0.25, while it costs $0.30 on M2. The demand (in number of cans) for the coming four weeks is given in the following table (see also problem_set2_S23PT. xlsx). The table also contains the percentage capacity for the machines in each week; they are cleaned in alternating weeks. The demand must be met exactly each week. Excess production at the end of each week can be stored at a cost of $0.02 per can. However, we can store at most 2.500 cans per week. At the beginning of week 1 , we have 1,500 cans available in storage. Hines Foods wants to design a production plan that meets all requirements at minimum total cost. We will formulate this problem as a linear program using the following variables: xi: the number of cans produced on machine M1 in week i(i=1,2,3,4), yi : the number of cans produced on machine M2 in week i(i=1,2,3,4), zi : the number of cans stored in inventory at the end of week i(i=1,2,3,4). 1. Draw the graphical representation reflecting the local and national market purchases, demand, and inventory relations (clearly label each node in your network and identify/label each arc using expressions involving your decision variables). 2. Write down the objective function. The initial inventory of 1,500 cans should be ignored in the objective (this is a fixed cost, and already accounted for in the previous planning period). 3. Write down the inventory balance constraints for each month. 4. Write down the remaining constraints. For each type of constraint, first state its purpose, then give the constraint(s). 5. Implement and solve your LP model in Excel, and generate the Answer Report. For your convenience, the data is provided in the spreadsheet problem_set2_S23PT.x1sx. (Remember to solve your model as an LP by selecting Simplex LP as the solver engine.) What is the optimal objective value? What is the optimal solution? (If needed, round your answers to the nearest two decimal points) Hines Tomatoes Production Planning \begin{tabular}{|l|r|r|r|r|} \hline & Week 1 & Week 2 & Week 3 & Week 4 \\ \hline Demand & 10,000 & 12,000 & 11,000 & 13,000 \\ \hline Availability M1 & 100% & 60% & 100% & 60% \\ \hline Availability M2 & 75% & 100% & 75% & 100% \\ \hline \end{tabular} Production M1 Production M2 Ending Inventory Total cost


