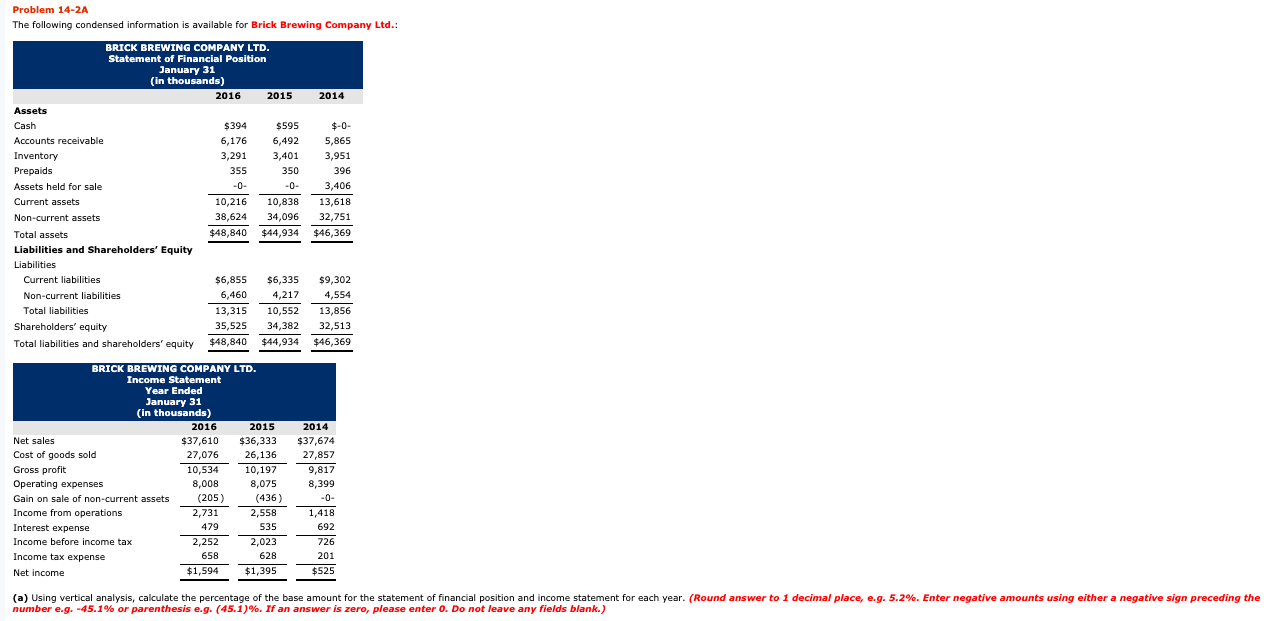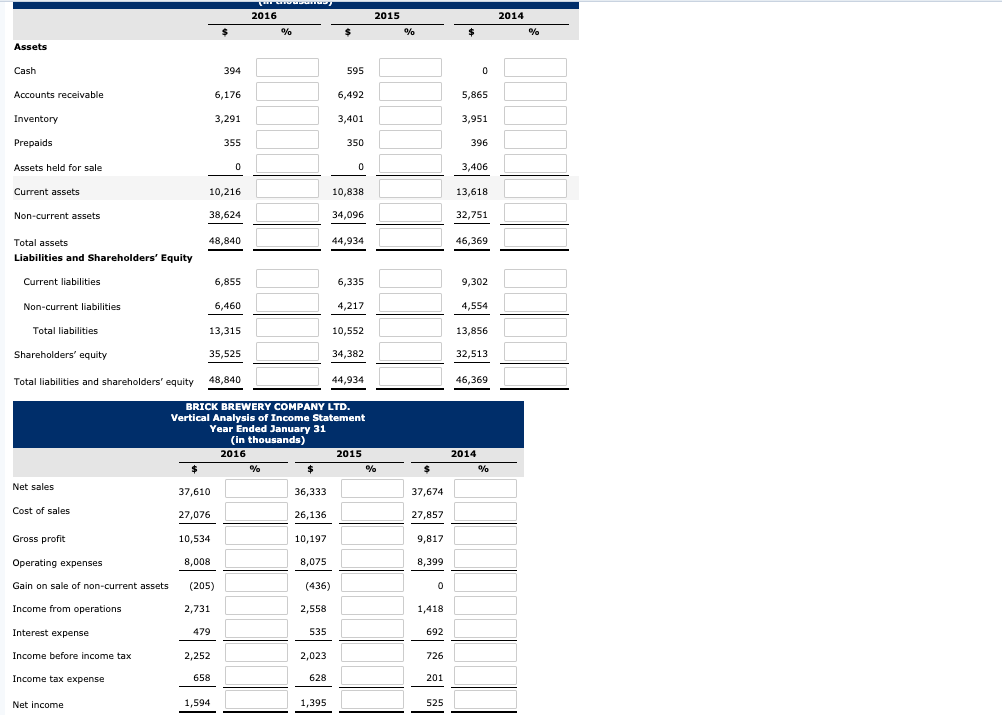

Problem 14-2A The following condensed information is available for Brick Brewing Company Ltd.: BRICK BREWING COMPANY LTD. Statement of Financial Position January 31 (in thousands) 2016 2015 2014 Assets Cash $394 $595 $-0- Accounts receivable 6,176 6,492 5,865 Inventory 3,291 3,401 3,951 Prepaids 355 350 396 Assets held for sale -0- 3,406 Current assets 10,216 10,838 13,618 M. Non-current assets 38,624 34,096 32,751 Total assets $48,840 $44,934 $46,369 Liabilities and Shareholders' Equity Liabilities Current liabilities $6,855 $6,335 $9,302 Non-current liabilities 6,460 4,217 4,554 Total liabilities 13,315 10,552 13,856 Shareholders' equity 35,525 34,382 32,513 Total liabilities and shareholders' equity $48,840 $44,934 $46,369 BRICK BREWING COMPANY LTD. Income Statement Year Ended January 31 (in thousands) 2016 2015 Net sales $37,610 $36,333 Cost of goods sold 27,076 26,136 Gross profit 10,534 10,197 Operating expenses 8,008 8,075 Gain on sale of non-current assets (205) (436) Income from operations 2,731 2,558 Interest expense 479 535 Income before income tax 2,252 2,023 Income tax expense 658 628 Net income $1,594 $1,395 2014 $37,674 27,857 9,817 8,399 1,418 692 726 201 $525 (a) Using vertical analysis, calculate the percentage of the base amount for the statement of financial position and income statement for each year. (Round answer to 1 decimal place, e.g. 5.2%. Enter negative amounts using either a negative sign preceding the number e.g. -45.1% or parenthesis e.g. (45.1)%. If an answer is zero, please enter O. Do not leave any fields blank.) mwan 2016 2015 2014 % % % Assets Cash 394 595 0 Accounts receivable 6,176 6,492 5,865 Inventory 3,291 3,401 3,951 Prepaids 355 350 396 Assets held for sale 0 0 3,406 Current assets 10,216 10,838 13,618 Non-current assets 38,624 34,096 32,751 48,840 44,934 46,369 Total assets Liabilities and Shareholders' Equity Current liabilities 6,855 6,335 9,302 Non-current liabilities 6,460 4,217 4,554 Total liabilities 13,315 10,552 13,856 Shareholders' equity 35,525 34,382 32,513 Total liabilities and shareholders' equity 48,840 44,934 46,369 BRICK BREWERY COMPANY LTD. Vertical Analysis of Income Statement Year Ended January 31 (in thousands) 2016 2015 % % 2014 % Net sales 37,610 36,333 37,674 Cost of sales 27,076 26,136 27,857 Gross profit 10,534 10,197 9,817 Operating expenses 8,008 8,075 8,399 Gain on sale of non-current assets (205) (436) 0 Income from operations 2,731 2,558 1,418 Interest expense 479 535 692 Income before income tax 2,252 2,023 726 Income tax expense 658 628 201 Net income 1,594 1,395 525


