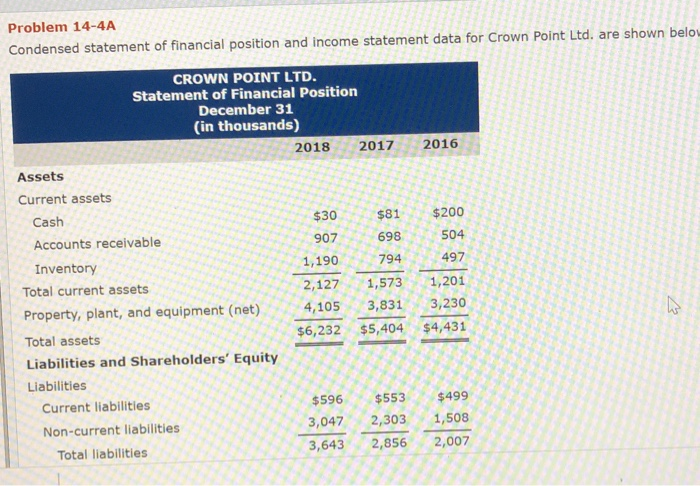
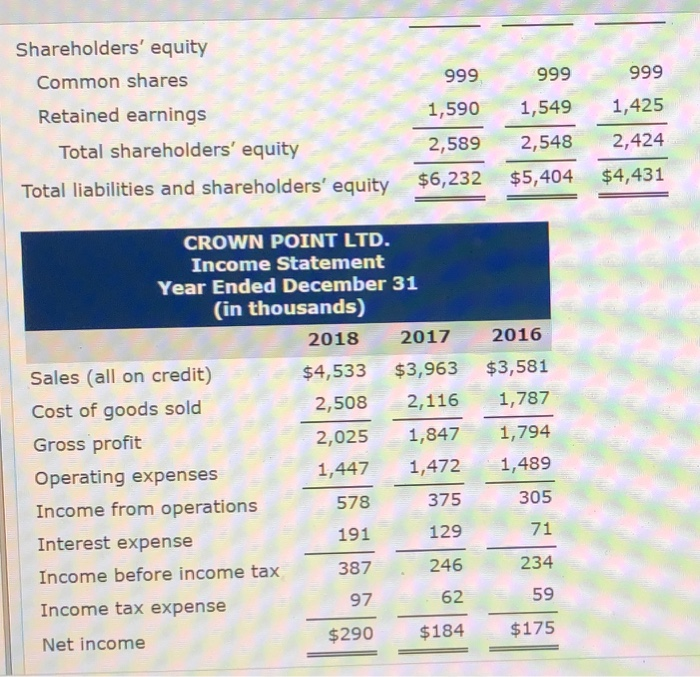
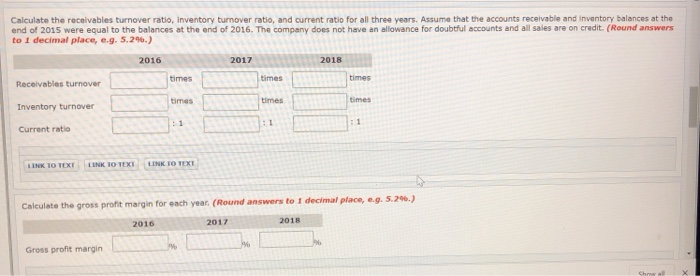
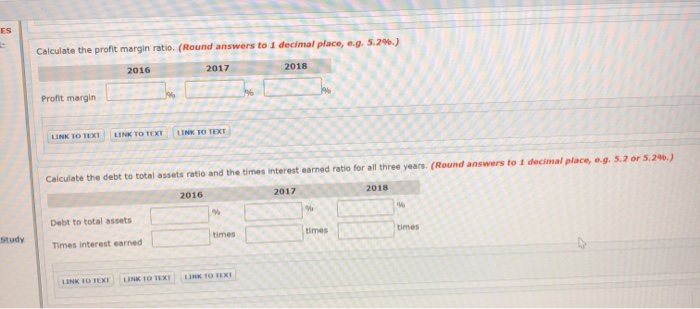
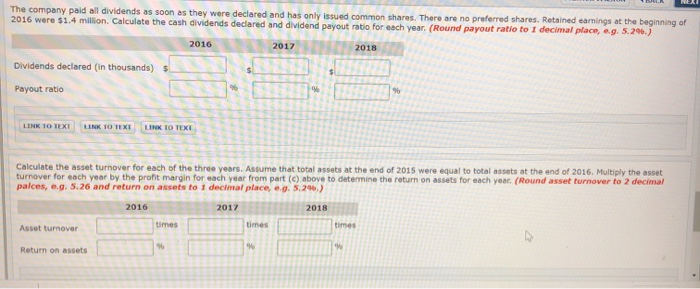
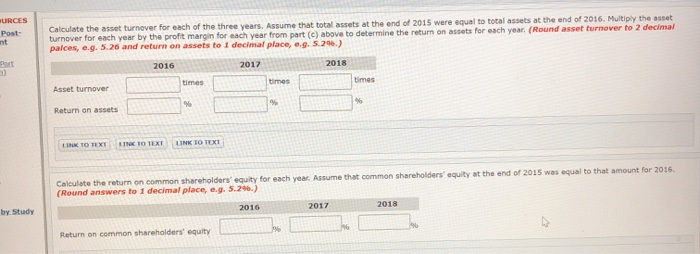
Problem 14-4A Condensed statement of financial position and income statement data for Crown Point Ltd. are shown below CROWN POINT LTD. Statement of Financial Position December 31 (in thousands) 2018 2017 2016 Assets Current assets Cash $30 $81 $200 Accounts receivable 907 698 504 1,190 Inventory 794 497 Total current assets 2,127 1,573 1,201 Property, plant, and equipment (net) 4,105 3,831 3,230 Total assets $6,232 $5,404 $4,431 Liabilities and Shareholders' Equity Liabilities Current liabilities $596 $553 $499 Non-current liabilities 3,047 2,303 1,508 Total liabilities 3,643 2,856 2,007 999 999 999 Shareholders' equity Common shares Retained earnings Total shareholders' equity 1,590 1,549 1,425 2,548 2,589 $6,232 2,424 $4,431 $5,404 Total liabilities and shareholders' equity 2016 CROWN POINT LTD. Income Statement Year Ended December 31 (in thousands) 2018 2017 Sales (all on credit) $4,533 $3,963 Cost of goods sold 2,508 2,116 Gross profit 2,025 1,847 Operating expenses 1,447 1,472 Income from operations 578 375 Interest expense 191 129 Income before income tax 387 246 Income tax expense 97 62 Net income $290 $184 $3,581 1,787 1,794 1,489 305 71 234 59 $175 Calculate the receivables turnover ratio, inventory turnover ratio, and current ratio for all three years. Assume that the accounts receivable and inventory balances at the end of 2015 were equal to the balances at the end of 2016. The company does not have an allowance for doubtful accounts and all sales are on credit. (Round answers to 1 decimal place, e.g. 5.29.) 2016 2017 2018 times times times Receivables turnover times times times Inventory turnover :1 Current ratio LINK TO TOXI LINK TO TEXT LINK TO TEXT Calculate the gross profit margin for each year. (Round answers to 1 decimal place, e.g. 5.29.) 2016 2017 2018 Gross profit margin Che ES Calculate the profit margin ratio. (Round answers to 1 decimal place, e.g. 5.2%) 2016 2017 2018 Profit margin 196 LINK TO TEXI LINK TO TEXT LINK TO TEXT Calculate the debt to total assets ratio and the times interest earned ratio for all three years. (Round answers to I decimal place, .g. 5.2 or 5.29.) 2017 2018 2016 Me Debt to total assets times times times Study Times Interest earned LINK TO TEKE LINK TO TEXI LINK TO TEXT NE The company paid all dividends as soon as they were declared and has only issued common shares. There are no preferred shares. Retained earnings at the beginning of 2016 were $1.4 million. Calculate the cash dividends declared and dividend payout ratio for each year. (Round payout ratio to I decimal place, ag. 5.296.) 2016 2017 2018 Dividends declared (in thousands) Payout ratio 90 LINK TO TEXT LINK TO TEXT LINK TO TEXE Calculate the asset turnover for each of the three years. Assume that total assets at the end of 2015 were equal to total assets at the end of 2016. Multiply the asset turnover for each year by the profit margin for each year from part (C) above to determine the return on assets for each year. (Round asset turnover to 2 decimal palces, e.g. 5.26 and return on assets to 1 decimal place, e.g. 5.296.) 2016 2017 2018 times times Asset turnover times Return on assets % URCES Post- mt Calculate the asset turnover for each of the three years. Assume that total assets at the end of 2015 were equal to total assets at the end of 2016. Multiply the asset turnover for each year by the profit margin for each year from part (c) above to determine the return on assets for each year. (Round asset turnover to 2 decimal palces, e.g. 5.26 and return on assets to 1 decimal place, ... 5.296.) 2016 2017 2018 times times times Asset turnover 96 Return on assets LINK TO TEXT UN TO TEXT LINK TO TEXT Calculate the return on common shareholders' equity for each year. Assume that common shareholders' equity at the end of 2015 was equal to that amount for 2016 (Round answers to 1 decimal place, e.g. 5.296.) 2016 2017 2018 by Study % Return on common shareholders' equity
