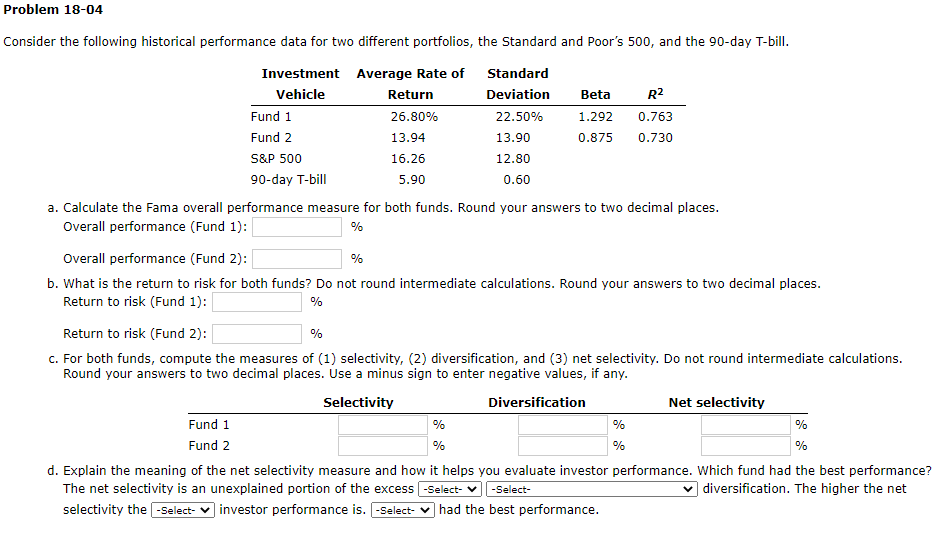
Problem 18-04 Consider the following historical performance data for two different portfolios, the Standard and Poor's 500, and the 90-day T-bill. Standard Investment Vehicle Average Rate of Return Deviation Beta 26.80% 22.50% 13.94 16.26 5.90 Fund 1 Fund 2 S&P 500 90-day T-bill 13.90 12.80 0.60 a. Calculate the Fama overall performance measure for both funds. Round your answers to two decimal places. Overall performance (Fund 1): % Fund 1 Fund 2 R 1.292 0.763 0.875 0.730 Overall performance (Fund 2): % b. What is the return to risk for both funds? Do not round intermediate calculations. Round your answers to two decimal places. Return to risk (Fund 1): % Return to risk (Fund 2): % c. For both funds, compute the measures of (1) selectivity, (2) diversification, and (3) net selectivity. Do not round intermediate calculations. Round your answers to two decimal places. Use a minus sign to enter negative values, if any. Selectivity % % Diversification % % Net selectivity % % d. Explain the meaning of the net selectivity measure and how it helps you evaluate investor performance. Which fund had the best performance? The net selectivity is an unexplained portion of the excess -Select--Select- diversification. The higher the net selectivity the -Select- investor performance is. [-Select- had the best performance. Problem 18-04 Consider the following historical performance data for two different portfolios, the Standard and Poor's 500, and the 90-day T-bill. Standard Investment Vehicle Average Rate of Return Deviation Beta 26.80% 22.50% 13.94 16.26 5.90 Fund 1 Fund 2 S&P 500 90-day T-bill 13.90 12.80 0.60 a. Calculate the Fama overall performance measure for both funds. Round your answers to two decimal places. Overall performance (Fund 1): % Fund 1 Fund 2 R 1.292 0.763 0.875 0.730 Overall performance (Fund 2): % b. What is the return to risk for both funds? Do not round intermediate calculations. Round your answers to two decimal places. Return to risk (Fund 1): % Return to risk (Fund 2): % c. For both funds, compute the measures of (1) selectivity, (2) diversification, and (3) net selectivity. Do not round intermediate calculations. Round your answers to two decimal places. Use a minus sign to enter negative values, if any. Selectivity % % Diversification % % Net selectivity % % d. Explain the meaning of the net selectivity measure and how it helps you evaluate investor performance. Which fund had the best performance? The net selectivity is an unexplained portion of the excess -Select--Select- diversification. The higher the net selectivity the -Select- investor performance is. [-Select- had the best performance