

Answered step by step
Verified Expert Solution
Question
1 Approved Answer
Problem 3 0 solutions submitted ( max: 4 ) Create a script that projects population based on static: Birth Rate ( BR ) Death Rate
Problem
solutions submitted max:
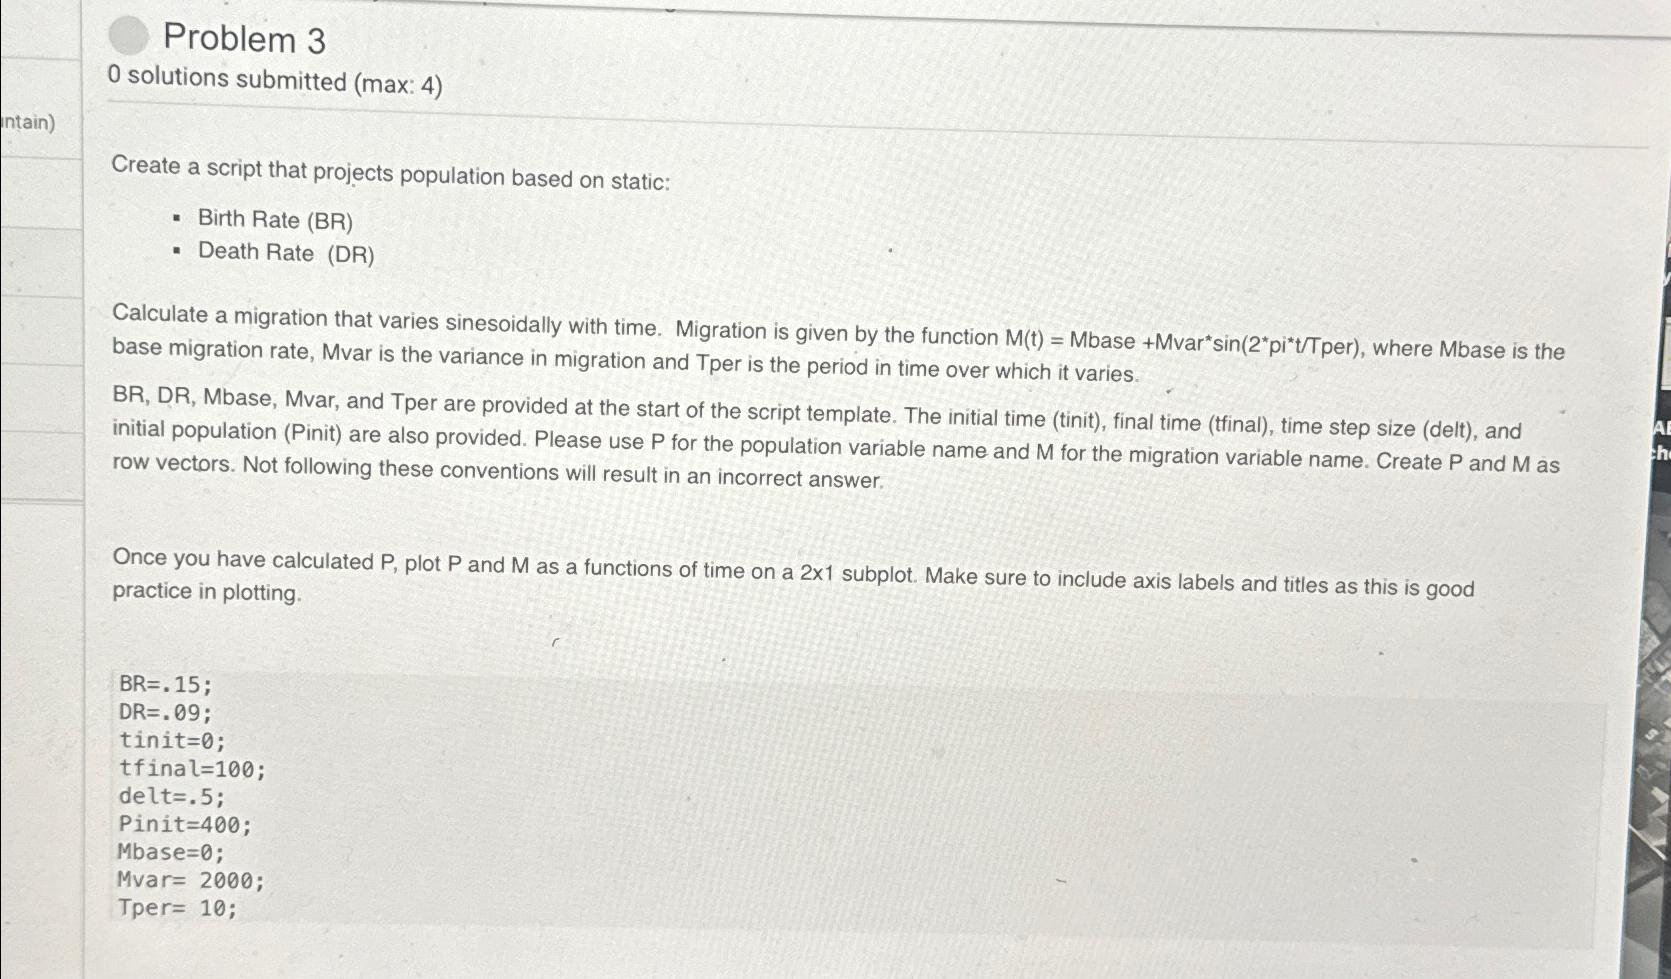
Create a script that projects population based on static:
Birth Rate BR
Death Rate DR
Calculate a migration that varies sinesoidally with time. Migration is given by the function Mbaseper where Mbase is the base migration rate, Mvar is the variance in migration and Tper is the period in time over which it varies.
BR DR Mbase, Mvar, and Tper are provided at the start of the script template. The initial time tinit final time tfinal time step size delt and initial population Pinit are also provided. Please use for the population variable name and for the migration variable name. Create and as row vectors. Not following these conventions will result in an incorrect answer.
Once you have calculated plot and as a functions of time on a subplot. Make sure to include axis labels and titles as this is good practice in plotting.
;
;
tinit ;
tfinal ;
delt ;
Pinit ;
Mbase ;
Mvar ;
Tper ;
Step by Step Solution
There are 3 Steps involved in it
Step: 1

Get Instant Access to Expert-Tailored Solutions
See step-by-step solutions with expert insights and AI powered tools for academic success
Step: 2

Step: 3
Ace Your Homework with AI
Get the answers you need in no time with our AI-driven, step-by-step assistance
Get Started
Ontologies Based Databases And Information Systems First And Second Vldb Workshops Odbis 2005/2006 Trondheim Norway September 2005 Seoul Korea September 2006 Revised Papers Lncs 4623
Authors: Martine Collard
2007th Edition
3540754733, 978-3540754732