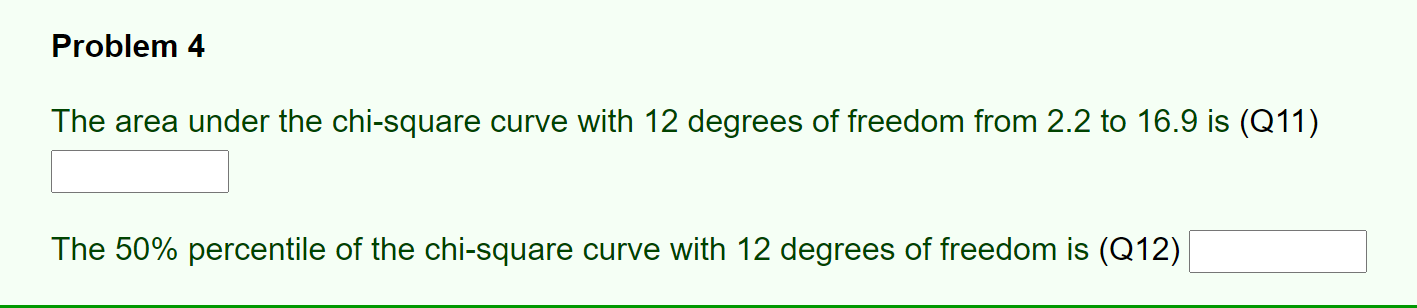
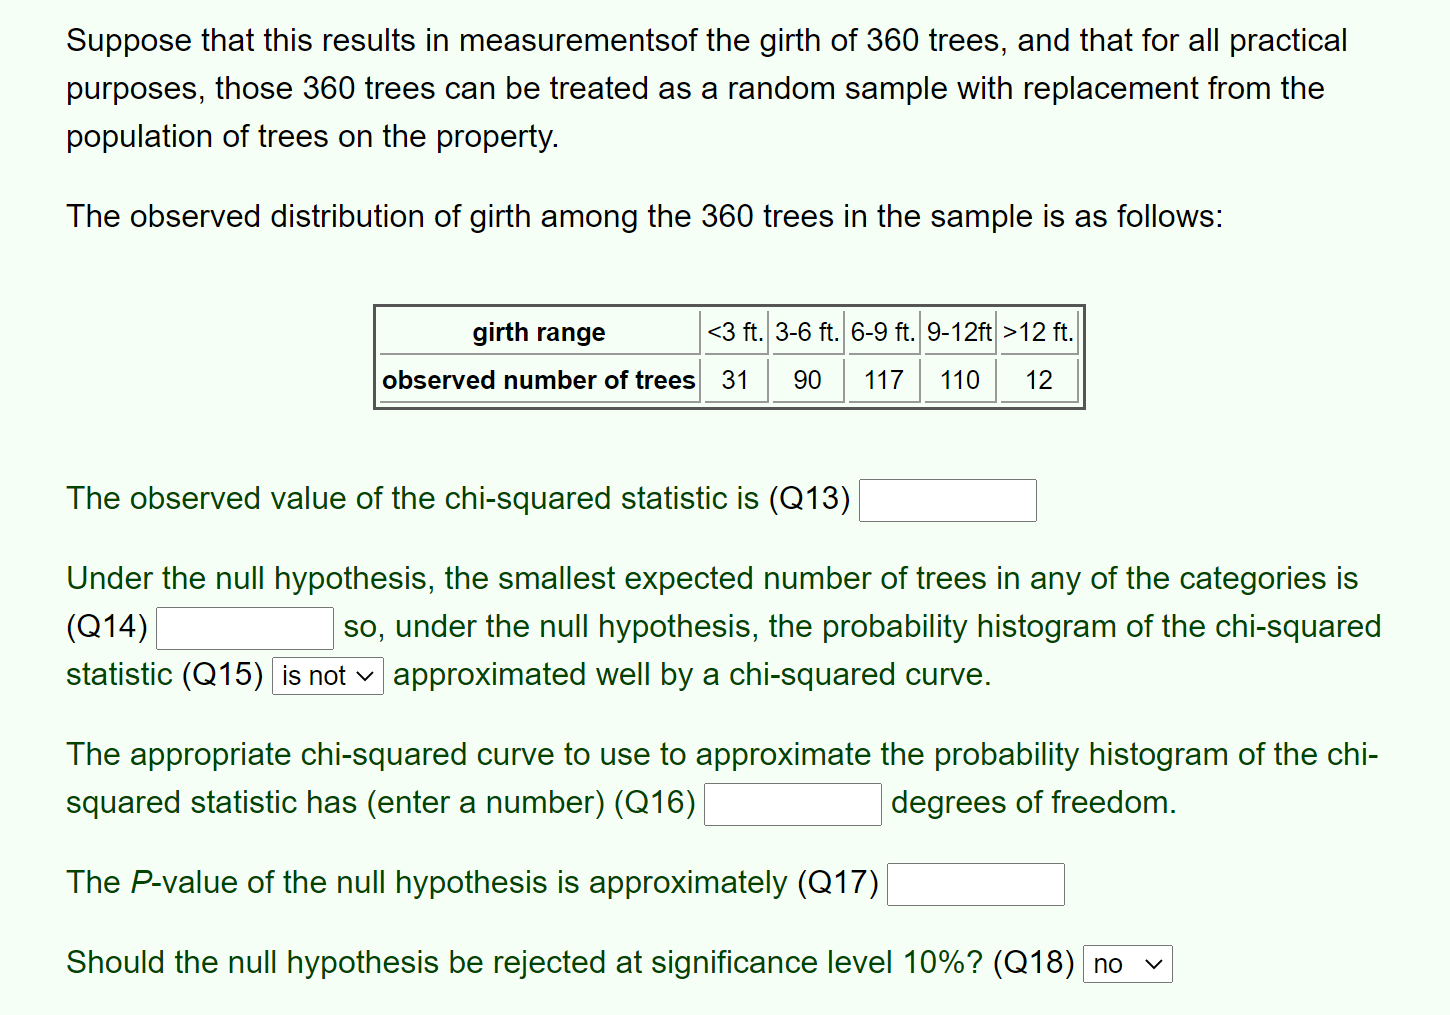
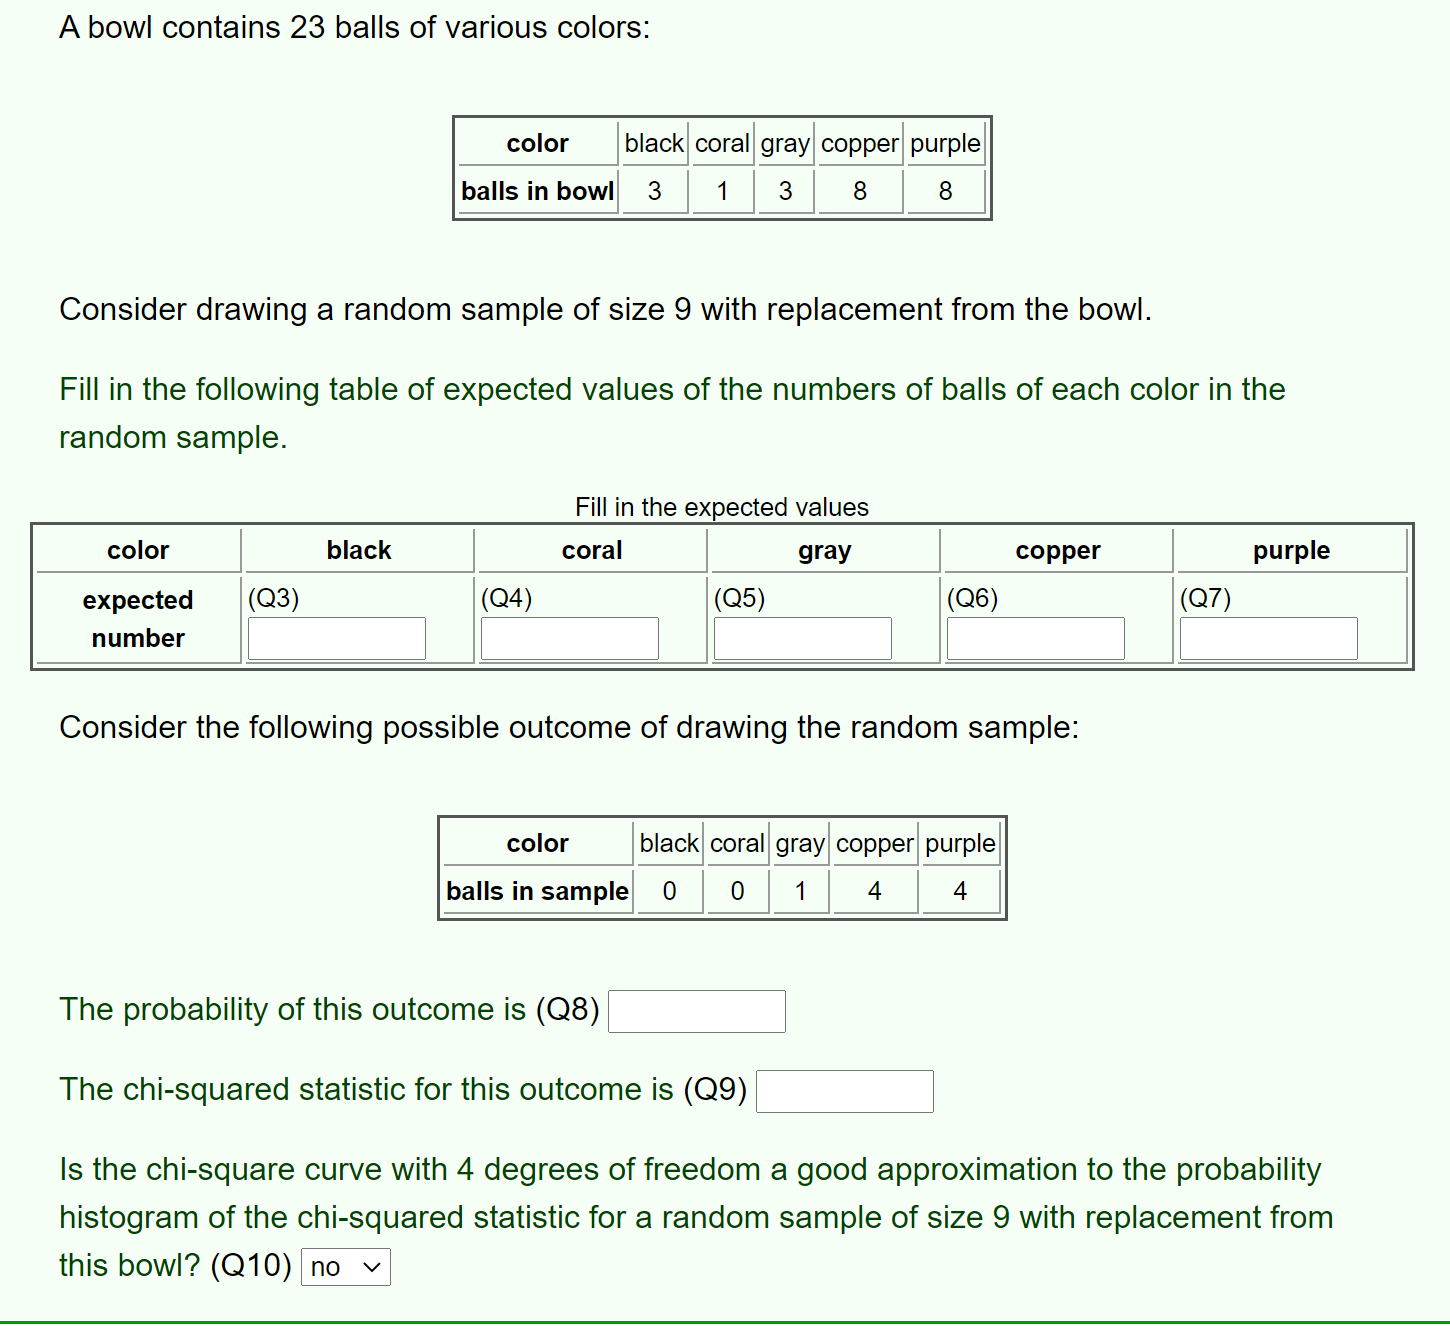
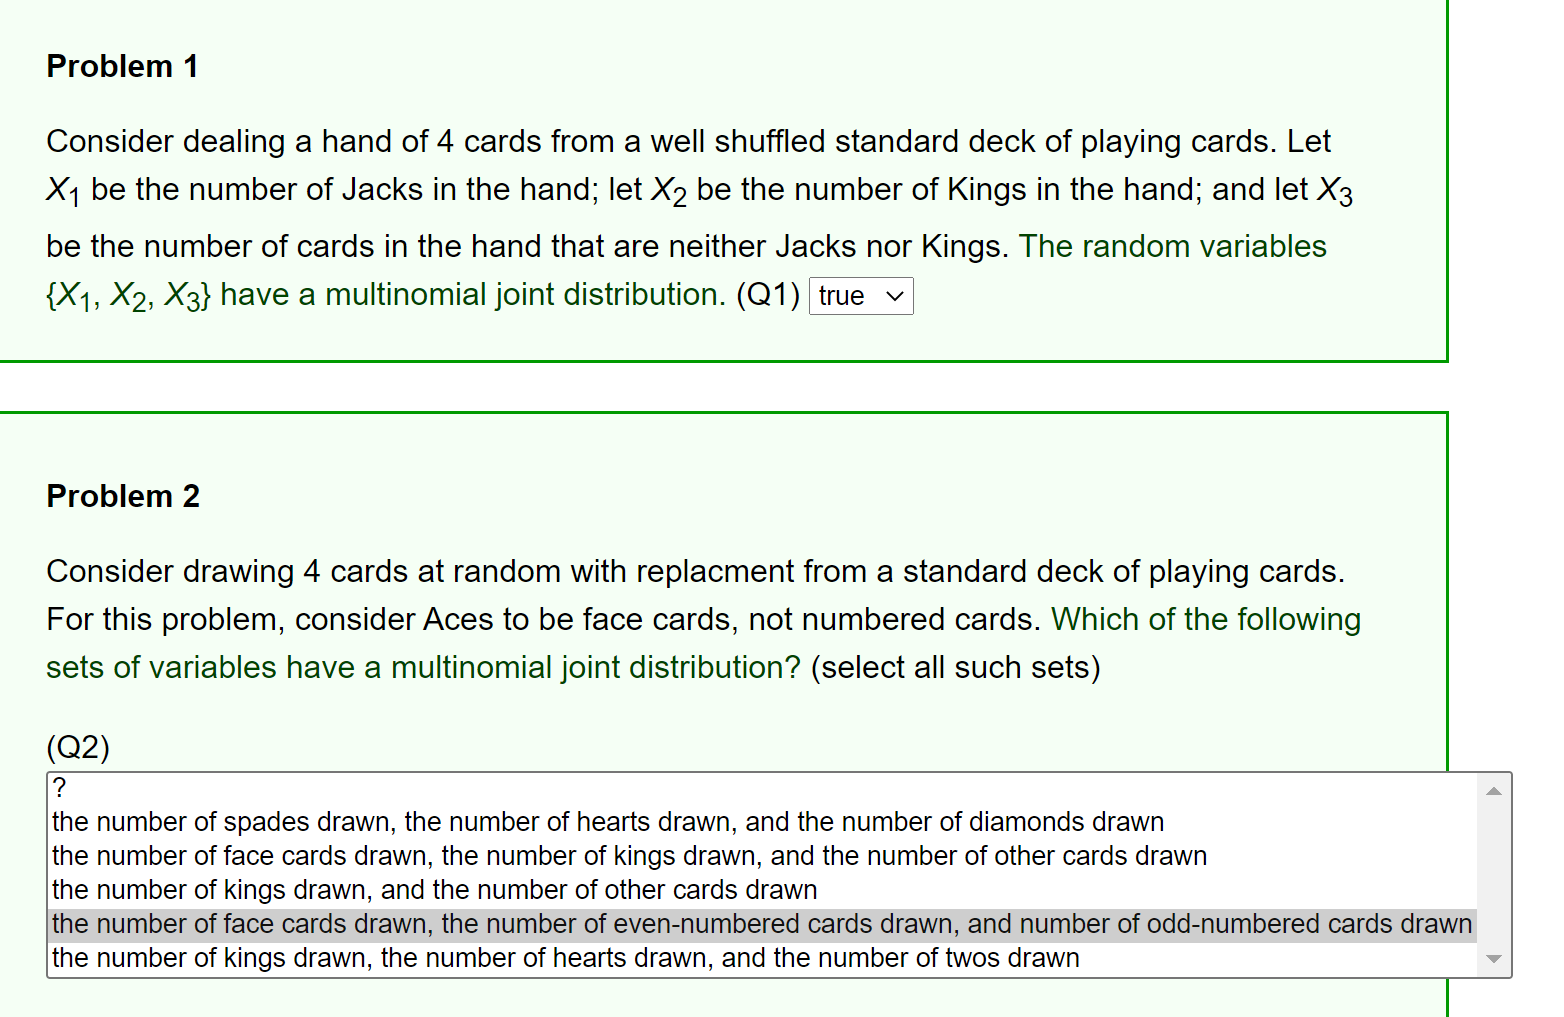
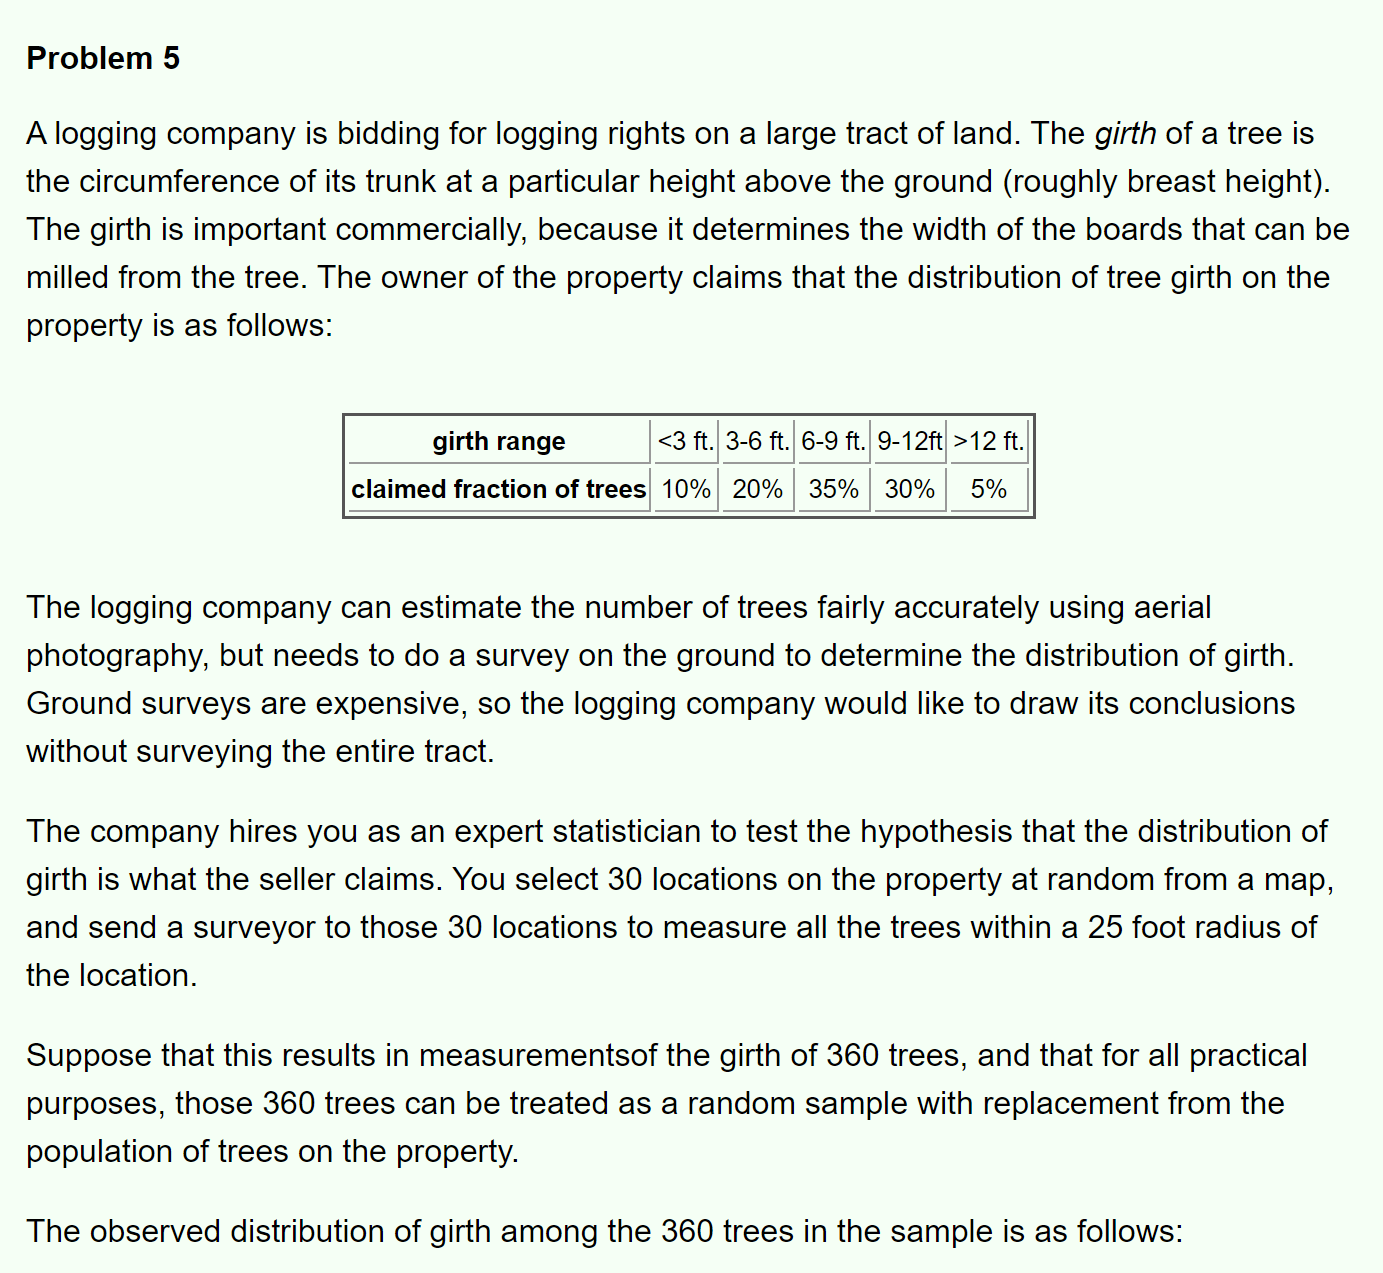
Problem 4 The area under the chi-square curve with 12 degrees of freedom from 2.2 to 16.9 is (Q11) E The 50% percentile of the chi-square curve with 12 degrees of freedom is (Q12) E Suppose that this results in measurementsof the girth of 360 trees, and that for all practical purposes, those 360 trees can be treated as a random sample with replacement from the population of trees on the property. The observed distribution of girth among the 360 trees in the sample is as follows: girth range w >12 ft. observed number oftrees 12 The observed value of the chi-squared statistic is (Q13) S Under the null hypothesis, the smallest expected number of trees in any of the categories is (Q14) S so, under the null hypothesis, the probability histogram of the chi-squared statistic (Q15) approximated well by a chi-squared curve. The appropriate chi-squared curve to use to approximate the probability histogram of the chi- squared statistic has (enter a number) (Q16) S degrees of freedom. The P-value of the null hypothesis is approximately (Q17) S Should the null hypothesis be rejected at significance level 10%? (Q18) A bowl contains 23 balls of various colors: color black coral gray copper purple balls in bowl 1 3 8 8 Consider drawing a random sample of size 9 with replacement from the bowl. Fill in the following table of expected values of the numbers of balls of each color in the random sample. Fill in the expected values color black coral gray copper purple expected Q3) (Q4) Q5) (Q6) (Q7) number Consider the following possible outcome of drawing the random sample: color black coral gray copper purple balls in sample 0 0 4 4 The probability of this outcome is (Q8) The chi-squared statistic for this outcome is (Q9) Is the chi-square curve with 4 degrees of freedom a good approximation to the probability histogram of the chi-squared statistic for a random sample of size 9 with replacement from this bowl? (Q10) no vProblem 1 Consider dealing a hand of4 cards from a well shufed standard deck of playing cards. Let X1 be the number of Jacks in the hand; let X2 be the number of Kings in the hand; and let X3 be the number of cards in the hand that are neither Jacks nor Kings. The random variables {X1, X2, X3} have a multinomial joint distribution. (Q1) Problem 2 Consider drawing 4 cards at random with replacment from a standard deck of playing cards. For this problem, consider Aces to be face cards, not numbered cards. Which of the following sets of variables have a multinomial joint distribution? (select all such sets) (Q2) ? the number of spades drawn, the number of hearts drawn, and the number of diamonds drawn the number of face cards drawn, the number of kings drawn, and the number of other cards drawn the number of kings drawn, and the number of other cards drawn the number of face cards drawn, the number of even-numbered cards drawn, and number of odd-numbered cards drawn the number of kings drawn, the number of hearts drawn, and the number of twos drawn v Problem 5 A logging company is bidding for logging rights on a large tract of land. The girth of a tree is the circumference of its trunk at a particular height above the ground (roughly breast height). The girth is important commercially, because it determines the width of the boards that can be milled from the tree. The owner of the property claims that the distribution of tree girth on the property is as follows: girth range m >12 ft. claimed fraction of trees 10% 20% 35% 30% 5% The logging company can estimate the number of trees fairly accurately using aerial photography, but needs to do a survey on the ground to determine the distribution of girth. Ground surveys are expensive, so the logging company would like to draw its conclusions without surveying the entire tract. The company hires you as an expert statistician to test the hypothesis that the distribution of girth is what the seller claims. You select 30 locations on the property at random from a map, and send a surveyor to those 30 locations to measure all the trees within a 25 foot radius of the location. Suppose that this results in measurementsof the girth of 360 trees, and that for all practical purposes, those 360 trees can be treated as a random sample with replacement from the population of trees on the property. The observed distribution of girth among the 360 trees in the sample is as follows