

Answered step by step
Verified Expert Solution
Question
1 Approved Answer
Provided Information (&financial statements information is in the attachment) The JTP Company, located in Jenkintown, PA, is a small manufacturer and distributor of custom machined
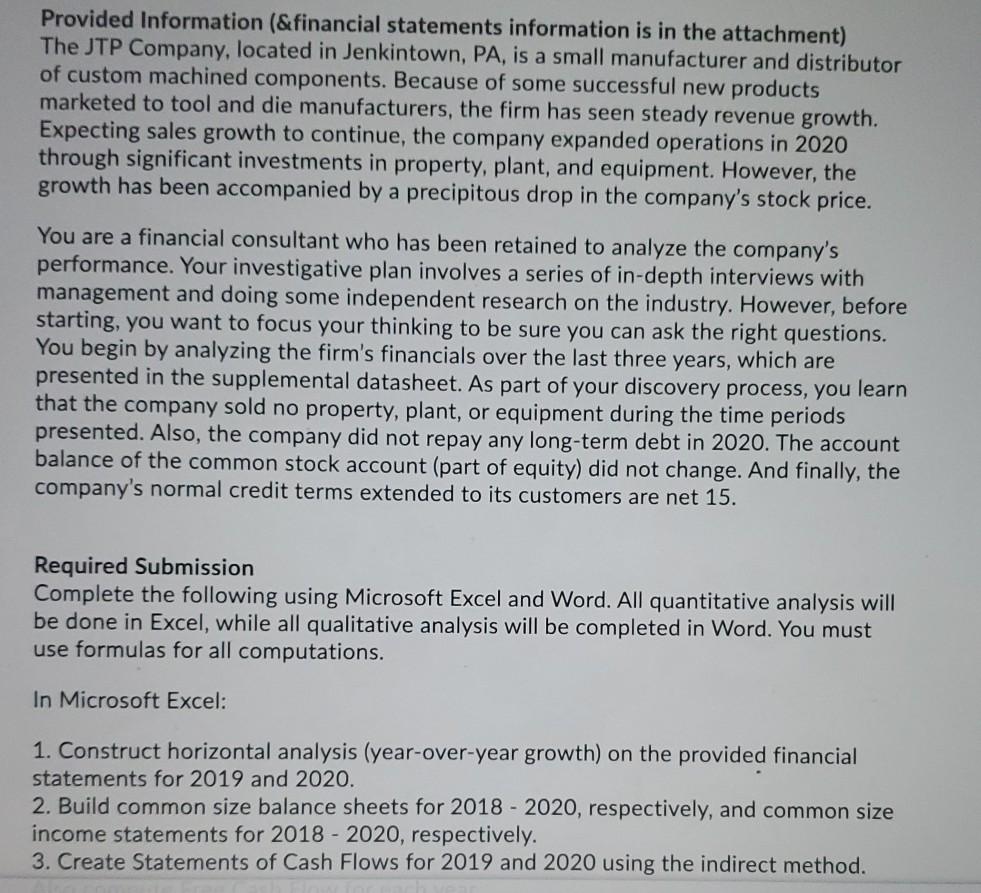
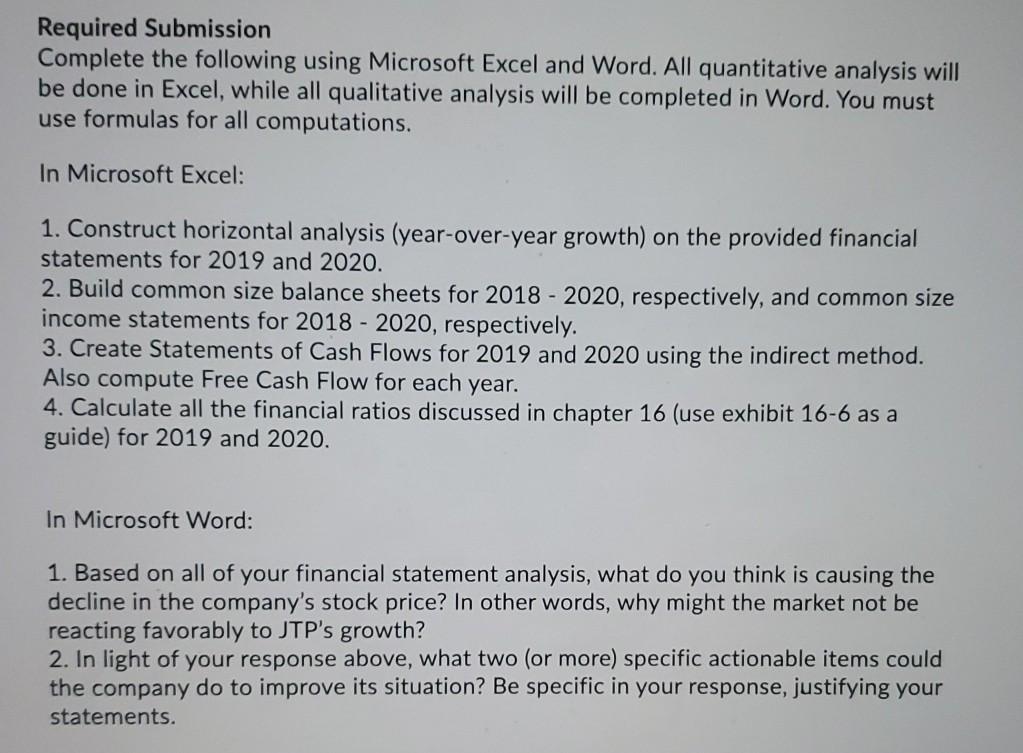
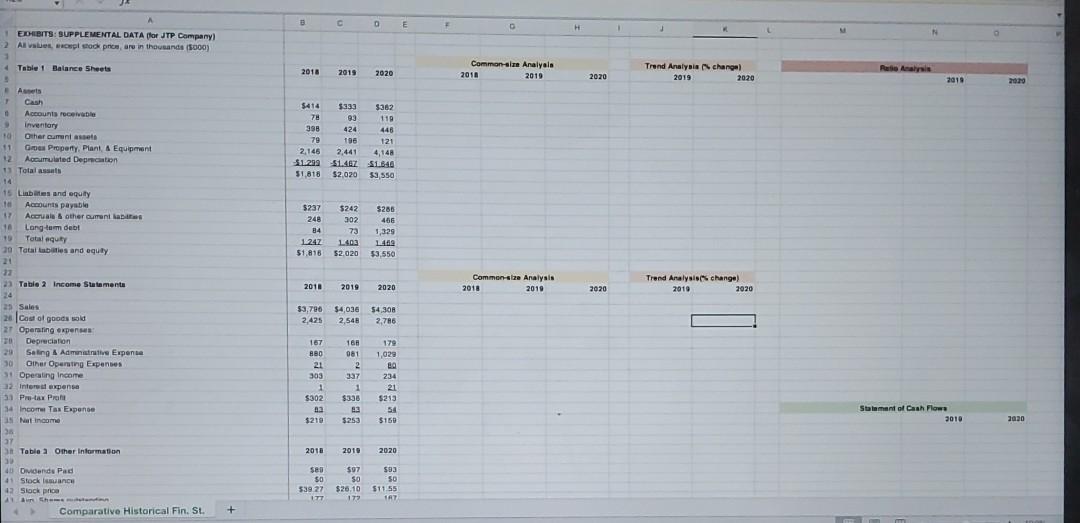
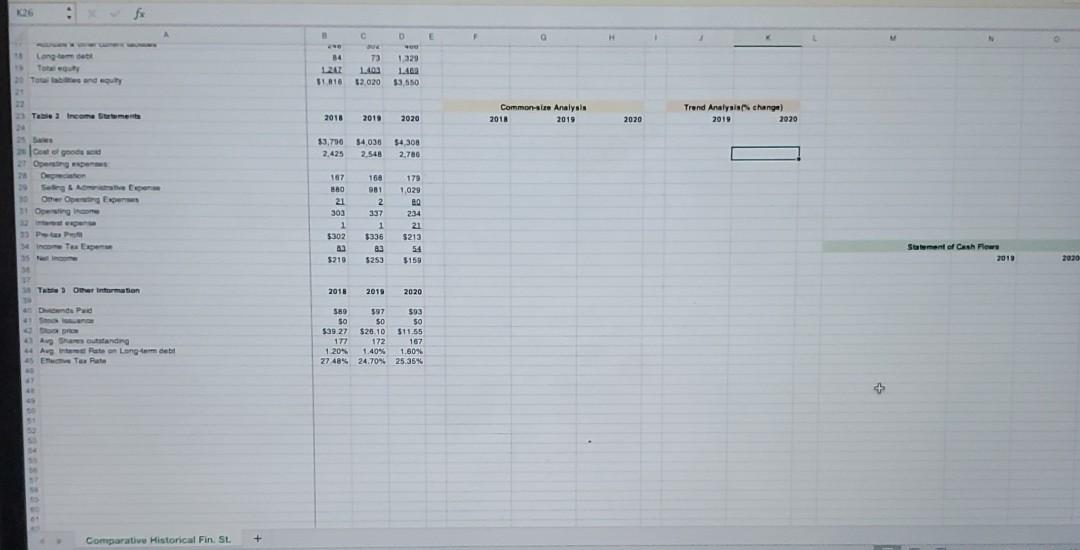
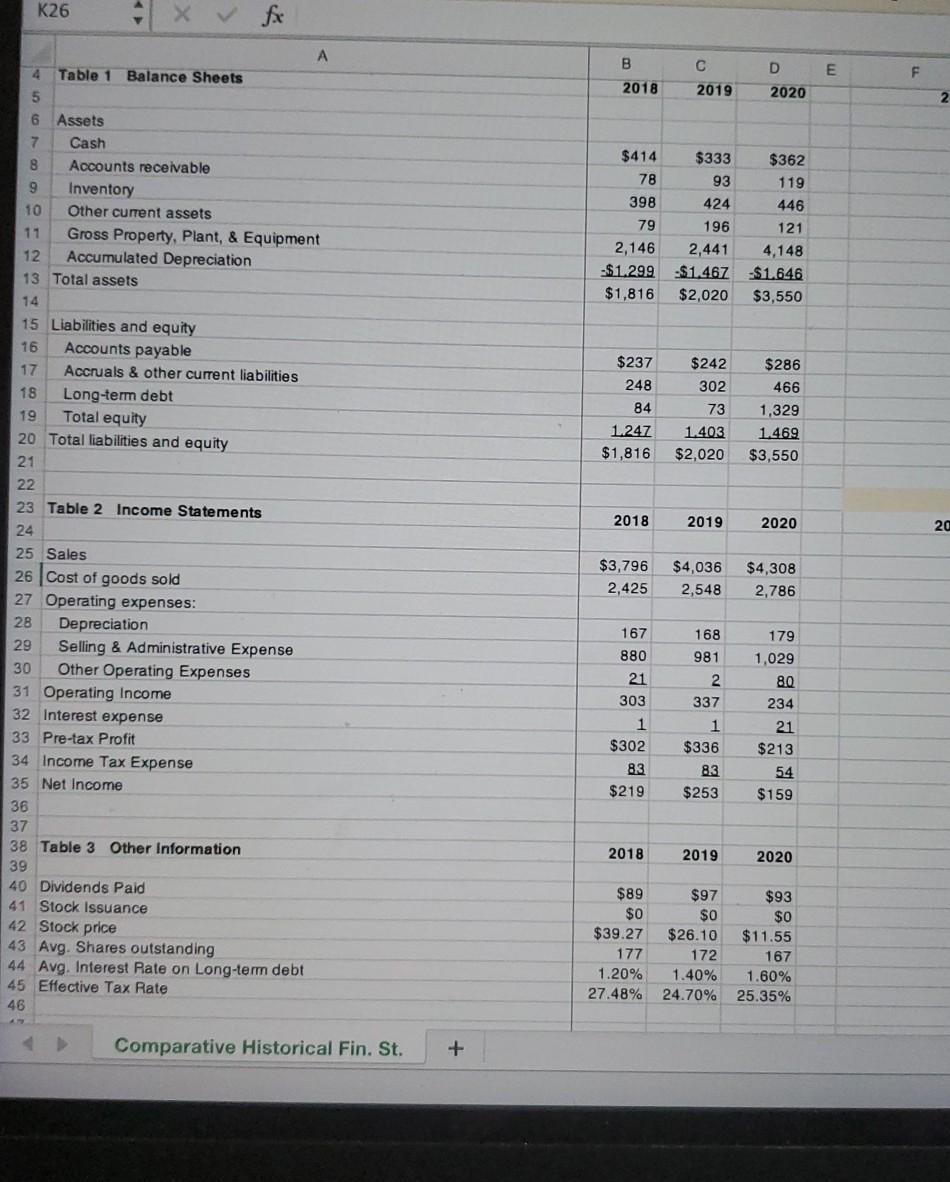
Provided Information (&financial statements information is in the attachment) The JTP Company, located in Jenkintown, PA, is a small manufacturer and distributor of custom machined components. Because of some successful new products marketed to tool and die manufacturers, the firm has seen steady revenue growth. Expecting sales growth to continue, the company expanded operations in 2020 through significant investments in property, plant, and equipment. However, the growth has been accompanied by a precipitous drop in the company's stock price. You are a financial consultant who has been retained to analyze the company's performance. Your investigative plan involves a series of in-depth interviews with management and doing some independent research on the industry. However, before starting, you want to focus your thinking to be sure you can ask the right questions. You begin by analyzing the firm's financials over the last three years, which are presented in the supplemental datasheet. As part of your discovery process, you learn that the company sold no property, plant, or equipment during the time periods presented. Also, the company did not repay any long-term debt in 2020. The account balance of the common stock account (part of equity) did not change. And finally, the company's normal credit terms extended to its customers are net 15. Required Submission Complete the following using Microsoft Excel and Word. All quantitative analysis will be done in Excel, while all qualitative analysis will be completed in Word. You must use formulas for all computations. In Microsoft Excel: 1. Construct horizontal analysis (year-over-year growth) on the provided financial statements for 2019 and 2020. 2. Build common size balance sheets for 2018 - 2020, respectively, and common size income statements for 2018 - 2020, respectively. 3. Create Statements of Cash Flows for 2019 and 2020 using the indirect method. Required Submission Complete the following using Microsoft Excel and Word. All quantitative analysis will be done in Excel, while all qualitative analysis will be completed in Word. You must use formulas for all computations. In Microsoft Excel: 1. Construct horizontal analysis (year-over-year growth) on the provided financial statements for 2019 and 2020. 2. Build common size balance sheets for 2018 - 2020, respectively, and common size income statements for 2018 - 2020, respectively. 3. Create Statements of Cash Flows for 2019 and 2020 using the indirect method. Also compute Free Cash Flow for each year. 4. Calculate all the financial ratios discussed in chapter 16 (use exhibit 16-6 as a guide) for 2019 and 2020. In Microsoft Word: 1. Based on all of your financial statement analysis, what do you think is causing the decline in the company's stock price? In other words, why might the market not be reacting favorably to JTP's growth? 2. In light of your response above, what two (or more) specific actionable items could the company do to improve its situation? Be specific in your response, justifying your statements. o E H 1 EXHIBITS: SUPPLEMENTAL DATA for JTP Company 2 Ali, nel stock pro are in thousands (5000) 4 Tablet Balance Sheets 2018 2015 Common aime Analyala 2018 2019 2020 Trend Analysis charge 2019 2020 2020 2019 20 $382 119 398 1 Cash Accounts receive Inventory 10 Other cuman assets 11 Ge Property. Plant A Equipment 2 Accumulated Deprecation 1 Total assas 5414 78 424 79 196 2,145 2,441 $1299 -$1.487 51,818 52,020 448 121 4,148 S1646 $1,550 15 Libiles and equity Accounts payable 17 Accrual & other current as Long-term debi Total auty 10 Total abilities and equity 5237 248 84 1247 51.818 5242 302 73 1403 52.020 $286 406 1,329 149 $3,550 2 23 Tabia 2 Income Statements Commen size Analysis 2018 2010 Trend Analysis change) 2010 2020 2018 2019 2020 2020 $3,790 2.425 $4,036 2,548 54,308 2,786 25 Sales 20 Coul of goods sold 27 Operating expenses Depreciation Saling Admorative Expense 30 Other Operating Expenses 31 Operating Income 12 Interdepensa 3 Pro-tax Pro 14 Income Tax Expense 15 Mal income 36 27 3 Table a Other information 167 BBD 21 303 1 $302 23 $210 16 081 2 2 337 1 $336 179 1,025 29 234 21 $213 54 $150 Statement of Cash Flowe 2010 5253 2020 2018 2010 2020 40 Odende Pad 41 Stock sunce 12 Stack pro 1 h Comparative Historical Fin. Si seo 50 539 27 TT $97 $0 $26.10 593 SO $11.55 TRY + $392 - Te Rare 27 48% + K26 B D E F 2018 2019 2020 $414 78 398 79 2,146 -$1.299 $1,816 $333 93 424 196 2,441 -$1,467 $2,020 $362 119 446 121 4,148 -$1.646 $3,550 $237 248 84 1.247 $1,816 $242 302 73 1.403 $2,020 $286 466 1,329 1.469 $3,550 2018 2019 4 Table 1 Balance Sheets 5 6 Assets 7 Cash 8 Accounts receivable 9 Inventory 10 Other current assets 11 Gross Property, Plant, & Equipment 12 Accumulated Depreciation 13 Total assets 14 15 Liabilities and equity 16 Accounts payable 17 Accruals & other current liabilities 18 Long-term debt 19 Total equity 20 Total liabilities and equity 21 22 23 Table 2 Income Statements 24 25 Sales 26 Cost of goods sold 27 Operating expenses: 28 Depreciation 29 Selling & Administrative Expense 30 Other Operating Expenses 31 Operating Income 32 Interest expense 33 Pre-tax Profit 34 Income Tax Expense 35 Net Income 36 37 38 Table 3 Other Information 39 40 Dividends Paid 41 Stock Issuance 42 Stock price 43 Avg. Shares outstanding 44 Avg. Interest Rate on Long-term debt 45 Effective Tax Rate 46 2020 20 $3,796 2,425 $4,036 2,548 $4,308 2,786 168 981 179 1,029 80 234 2 337 167 880 21 303 1 $302 83 $219 1 $336 83 $253 21 $213 54 $159 2018 2019 2020 $89 $0 $39.27 177 1.20% 27.48% $97 $0 $26.10 172 1.40% 24.70% $93 $0 $11.55 167 1.60% 25.35% Comparative Historical Fin. St. + Provided Information (&financial statements information is in the attachment) The JTP Company, located in Jenkintown, PA, is a small manufacturer and distributor of custom machined components. Because of some successful new products marketed to tool and die manufacturers, the firm has seen steady revenue growth. Expecting sales growth to continue, the company expanded operations in 2020 through significant investments in property, plant, and equipment. However, the growth has been accompanied by a precipitous drop in the company's stock price. You are a financial consultant who has been retained to analyze the company's performance. Your investigative plan involves a series of in-depth interviews with management and doing some independent research on the industry. However, before starting, you want to focus your thinking to be sure you can ask the right questions. You begin by analyzing the firm's financials over the last three years, which are presented in the supplemental datasheet. As part of your discovery process, you learn that the company sold no property, plant, or equipment during the time periods presented. Also, the company did not repay any long-term debt in 2020. The account balance of the common stock account (part of equity) did not change. And finally, the company's normal credit terms extended to its customers are net 15. Required Submission Complete the following using Microsoft Excel and Word. All quantitative analysis will be done in Excel, while all qualitative analysis will be completed in Word. You must use formulas for all computations. In Microsoft Excel: 1. Construct horizontal analysis (year-over-year growth) on the provided financial statements for 2019 and 2020. 2. Build common size balance sheets for 2018 - 2020, respectively, and common size income statements for 2018 - 2020, respectively. 3. Create Statements of Cash Flows for 2019 and 2020 using the indirect method. Required Submission Complete the following using Microsoft Excel and Word. All quantitative analysis will be done in Excel, while all qualitative analysis will be completed in Word. You must use formulas for all computations. In Microsoft Excel: 1. Construct horizontal analysis (year-over-year growth) on the provided financial statements for 2019 and 2020. 2. Build common size balance sheets for 2018 - 2020, respectively, and common size income statements for 2018 - 2020, respectively. 3. Create Statements of Cash Flows for 2019 and 2020 using the indirect method. Also compute Free Cash Flow for each year. 4. Calculate all the financial ratios discussed in chapter 16 (use exhibit 16-6 as a guide) for 2019 and 2020. In Microsoft Word: 1. Based on all of your financial statement analysis, what do you think is causing the decline in the company's stock price? In other words, why might the market not be reacting favorably to JTP's growth? 2. In light of your response above, what two (or more) specific actionable items could the company do to improve its situation? Be specific in your response, justifying your statements. o E H 1 EXHIBITS: SUPPLEMENTAL DATA for JTP Company 2 Ali, nel stock pro are in thousands (5000) 4 Tablet Balance Sheets 2018 2015 Common aime Analyala 2018 2019 2020 Trend Analysis charge 2019 2020 2020 2019 20 $382 119 398 1 Cash Accounts receive Inventory 10 Other cuman assets 11 Ge Property. Plant A Equipment 2 Accumulated Deprecation 1 Total assas 5414 78 424 79 196 2,145 2,441 $1299 -$1.487 51,818 52,020 448 121 4,148 S1646 $1,550 15 Libiles and equity Accounts payable 17 Accrual & other current as Long-term debi Total auty 10 Total abilities and equity 5237 248 84 1247 51.818 5242 302 73 1403 52.020 $286 406 1,329 149 $3,550 2 23 Tabia 2 Income Statements Commen size Analysis 2018 2010 Trend Analysis change) 2010 2020 2018 2019 2020 2020 $3,790 2.425 $4,036 2,548 54,308 2,786 25 Sales 20 Coul of goods sold 27 Operating expenses Depreciation Saling Admorative Expense 30 Other Operating Expenses 31 Operating Income 12 Interdepensa 3 Pro-tax Pro 14 Income Tax Expense 15 Mal income 36 27 3 Table a Other information 167 BBD 21 303 1 $302 23 $210 16 081 2 2 337 1 $336 179 1,025 29 234 21 $213 54 $150 Statement of Cash Flowe 2010 5253 2020 2018 2010 2020 40 Odende Pad 41 Stock sunce 12 Stack pro 1 h Comparative Historical Fin. Si seo 50 539 27 TT $97 $0 $26.10 593 SO $11.55 TRY + $392 - Te Rare 27 48% + K26 B D E F 2018 2019 2020 $414 78 398 79 2,146 -$1.299 $1,816 $333 93 424 196 2,441 -$1,467 $2,020 $362 119 446 121 4,148 -$1.646 $3,550 $237 248 84 1.247 $1,816 $242 302 73 1.403 $2,020 $286 466 1,329 1.469 $3,550 2018 2019 4 Table 1 Balance Sheets 5 6 Assets 7 Cash 8 Accounts receivable 9 Inventory 10 Other current assets 11 Gross Property, Plant, & Equipment 12 Accumulated Depreciation 13 Total assets 14 15 Liabilities and equity 16 Accounts payable 17 Accruals & other current liabilities 18 Long-term debt 19 Total equity 20 Total liabilities and equity 21 22 23 Table 2 Income Statements 24 25 Sales 26 Cost of goods sold 27 Operating expenses: 28 Depreciation 29 Selling & Administrative Expense 30 Other Operating Expenses 31 Operating Income 32 Interest expense 33 Pre-tax Profit 34 Income Tax Expense 35 Net Income 36 37 38 Table 3 Other Information 39 40 Dividends Paid 41 Stock Issuance 42 Stock price 43 Avg. Shares outstanding 44 Avg. Interest Rate on Long-term debt 45 Effective Tax Rate 46 2020 20 $3,796 2,425 $4,036 2,548 $4,308 2,786 168 981 179 1,029 80 234 2 337 167 880 21 303 1 $302 83 $219 1 $336 83 $253 21 $213 54 $159 2018 2019 2020 $89 $0 $39.27 177 1.20% 27.48% $97 $0 $26.10 172 1.40% 24.70% $93 $0 $11.55 167 1.60% 25.35% Comparative Historical Fin. St. +
Step by Step Solution
There are 3 Steps involved in it
Step: 1

Get Instant Access to Expert-Tailored Solutions
See step-by-step solutions with expert insights and AI powered tools for academic success
Step: 2

Step: 3
Ace Your Homework with AI
Get the answers you need in no time with our AI-driven, step-by-step assistance
Get Started
Financial Markets And Institutions
Authors: Frederic S. Mishkin, Stanley G. Eakin
7th Global Edition
0273754440, 9780273754442