

Question
Q1: First briefly explain the following graph in your own words and then answer the questions below. i) What is the economic definition of this
Q1: First briefly explain the following graph in your own words and then answer the questions below.
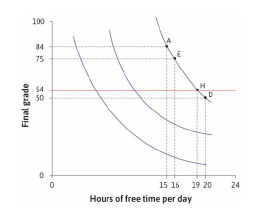
i) What is the economic definition of this curve? Why the curve is downward sloping? ii) What is the name of the slope of this curve? What is its economic importance? iii) Calculate the MRS as the hours of free time decline from 20 hours per day to 15 hours iv) Suppose the curve becomes more and more steeper. Explain how this change in the slope of the curve will impact the level of the final grade. v) What is the economic explanation of the horizontal red line at Y-axis point 54.
100 84 75 54 50 H D Final grade 0 24 15 16 19 20 Hours of free time per dayStep by Step Solution
There are 3 Steps involved in it
Step: 1

Get Instant Access to Expert-Tailored Solutions
See step-by-step solutions with expert insights and AI powered tools for academic success
Step: 2

Step: 3
Ace Your Homework with AI
Get the answers you need in no time with our AI-driven, step-by-step assistance
Get Started
Mostly Harmless Econometrics An Empiricist's Companion
Authors: J D Angrist, Joshua D Angrist
1st Edition
0691120358, 9780691120355