Answered step by step
Verified Expert Solution
Link Copied!

Question

1 Approved Answer

Q2 1 Point We expect the variability of a measure in the population (the standard deviation of our variable) to be _ than the variability
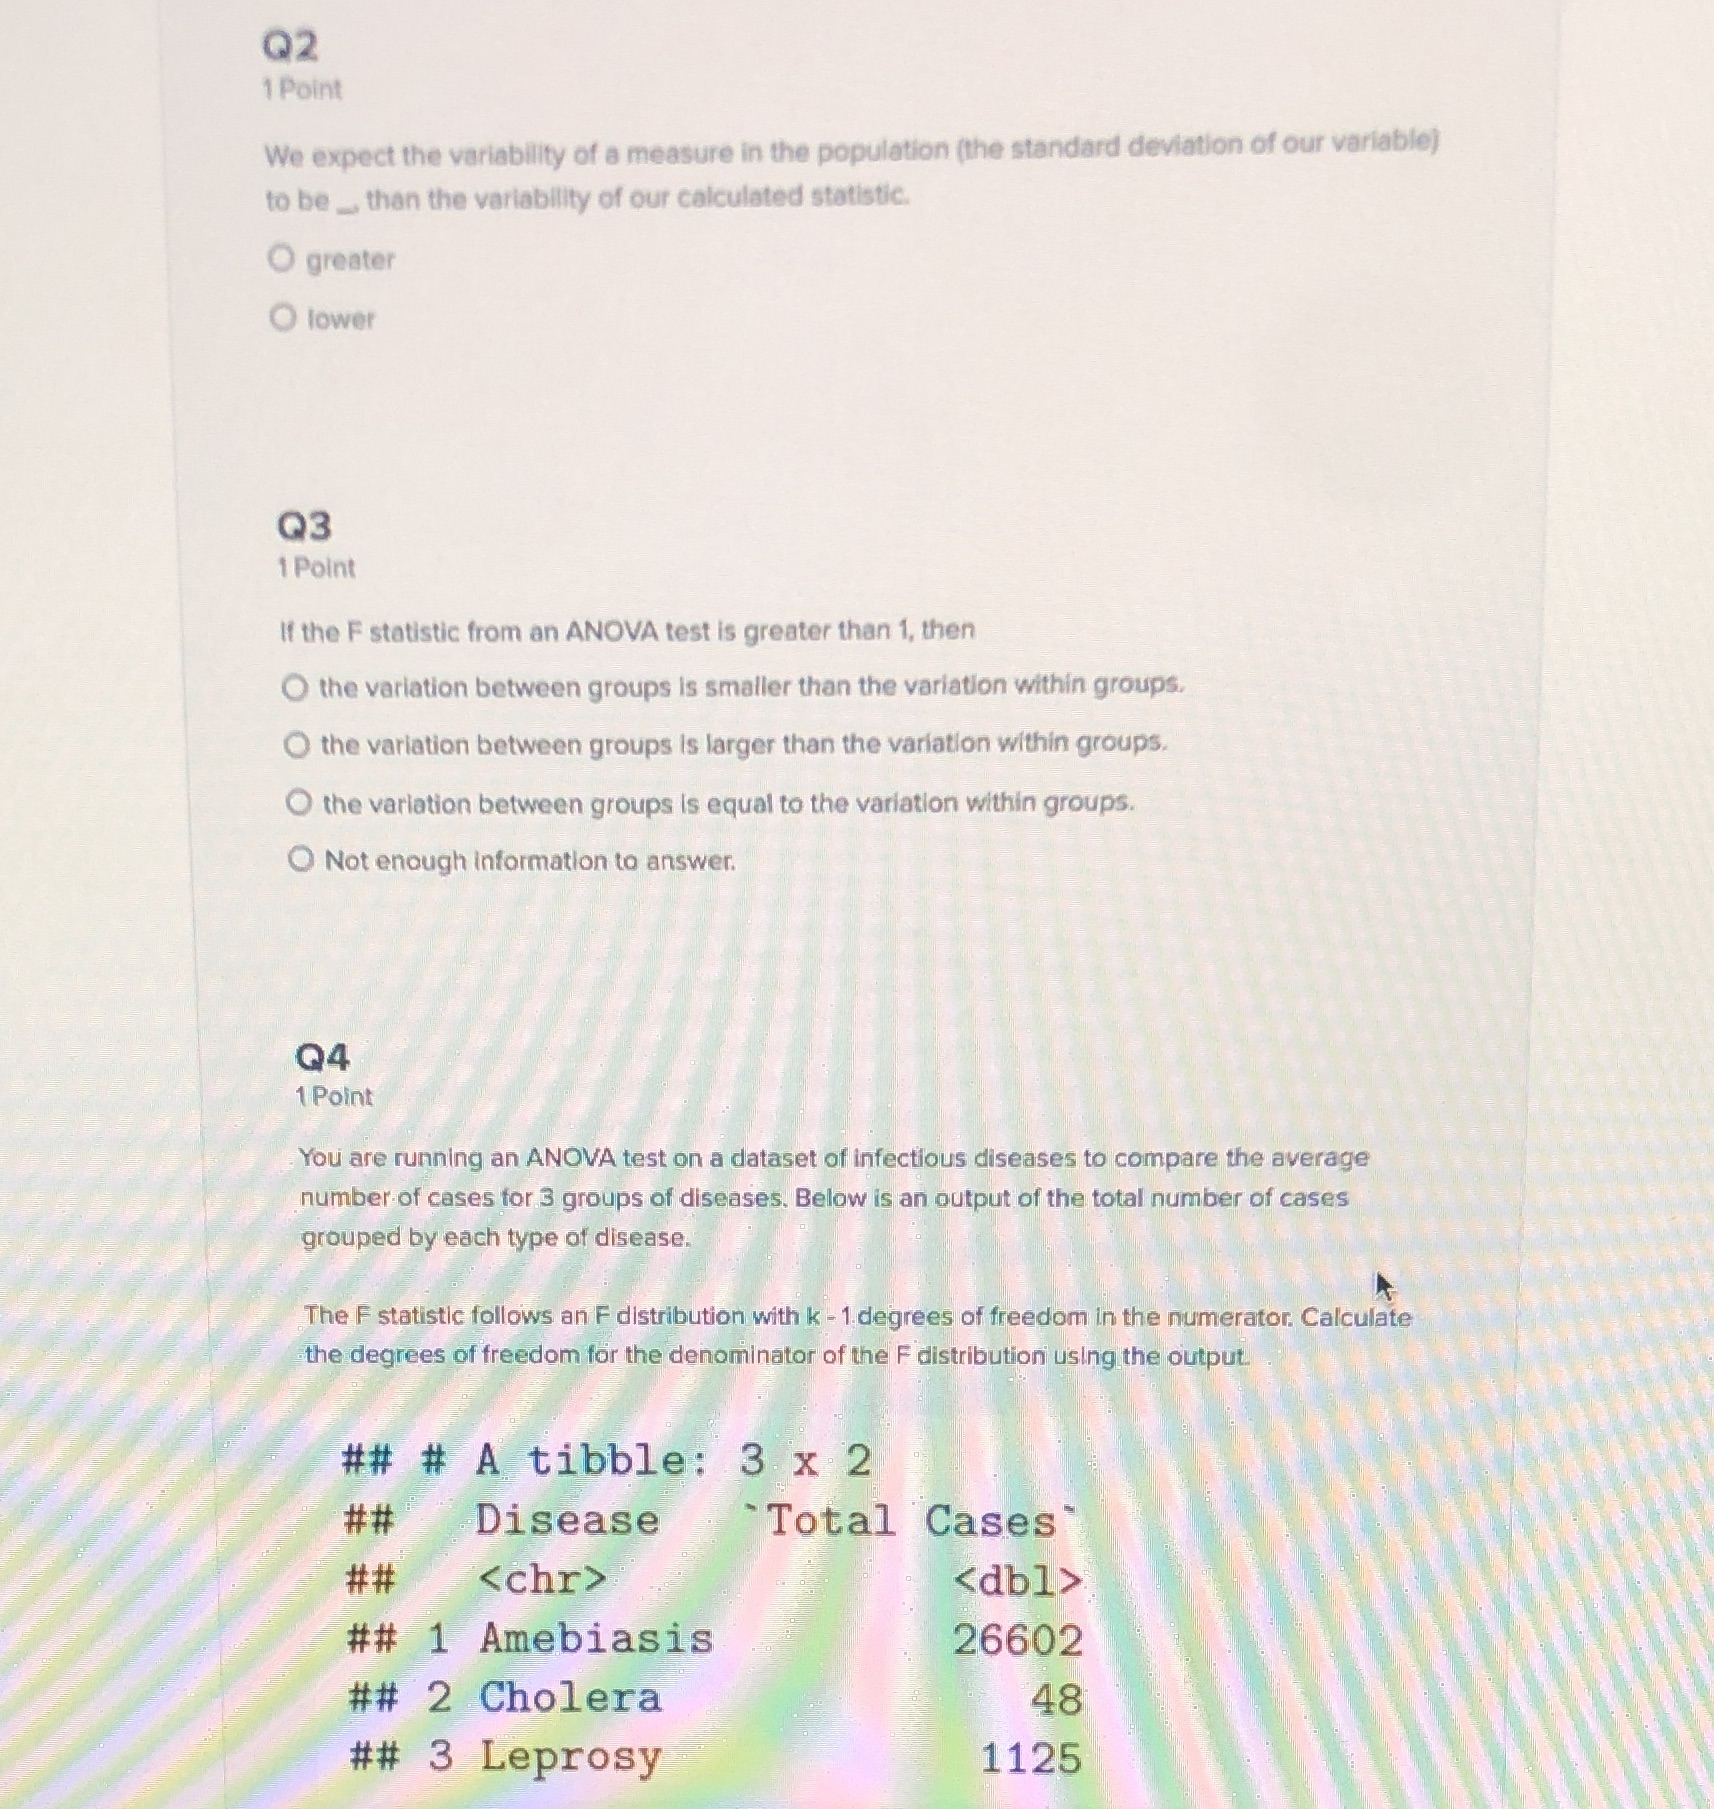
image text in transcribed
Q2 1 Point We expect the variability of a measure in the population (the standard deviation of our variable) to be _ than the variability of our calculated statistic. O greater lower Q3 1 Point If the F statistic from an ANOVA test is greater than 1, then the variation between groups is smaller than the variation within groups. the variation between groups is larger than the variation within groups. the variation between groups is equal to the variation within groups. O Not enough information to answer. Q4 Point You are running an ANOVA test on a dataset of infectious diseases to compare the average number of cases for 3 groups of diseases. Below is an output of the total number of cases grouped by each type of disease. The F statistic follows an F distribution with k - 1. degrees of freedom in the numerator. Calculate the degrees of freedom for the denominator of the F distribution using the output. ## # A tibble: 3 x 2 # # Disease `Total Cases # # ## 1 Amebiasis 26602 ## 2 Cholera 48 ## 3 Leprosy 1125

Step by Step Solution

There are 3 Steps involved in it

Step: 1

blur-text-image

Get Instant Access to Expert-Tailored Solutions

See step-by-step solutions with expert insights and AI powered tools for academic success

Step: 2

blur-text-image_2

Step: 3

blur-text-image_3

Ace Your Homework with AI

Get the answers you need in no time with our AI-driven, step-by-step assistance

Get Started

Recommended Textbook for

Mathematics Concepts With Applications

Authors: Charles P McKeague

1st Edition

1630983136, 9781630983130

More Books

Students also viewed these Mathematics questions