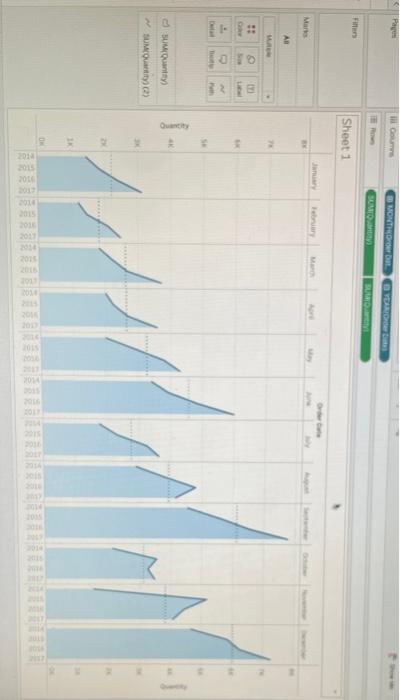
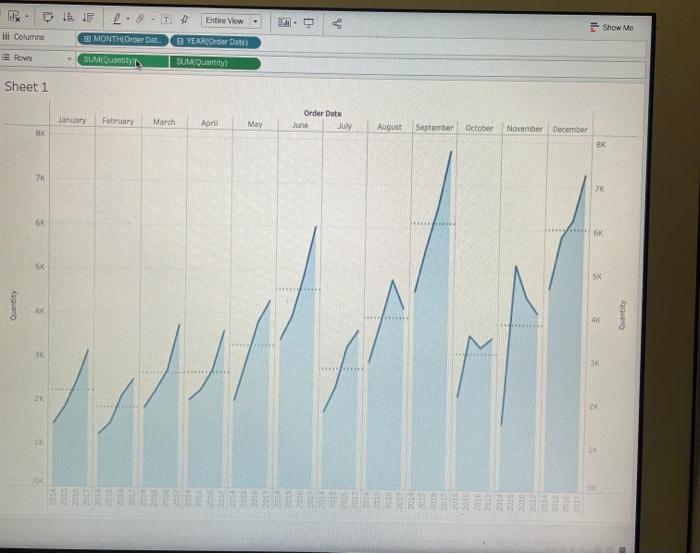
Q2. Seasonality. You have four years of data. You have noticed peak sales in terms of quantity of products sold during some months throughout the years. Does this indicate there is a seasonality in your data? Using the provided create_a_cycle_plot_starter twbx file, develop a cycle plot (using area chart is preferred) on quantity of products sold to understand seasonality in the data. Create something like the below figure but with quantity on the y-axis. Interpret and explain your results with the help of this chart. Based on this chart, provide your recommendations to the top management MONTHOOD SUMED Sheet1 Jun Sebrary AR 32 SE Quantity SUMQ SUMO 1 0 301 ME FEED TO Ix- BIF Entire View - 9P Show Me il Columns MONTHOrder Dat YEAR Order Date) Row SUMO SUMQuantity) Sheet1 Inary February March April May Order Date June July August September October November December BK 7K YK GK 5X AK BK 2x 1 Q2. Seasonality. You have four years of data. You have noticed peak sales in terms of quantity of products sold during some months throughout the years. Does this indicate there is a seasonality in your data? Using the provided create_a_cycle_plot_starter twbx file, develop a cycle plot (using area chart is preferred) on quantity of products sold to understand seasonality in the data. Create something like the below figure but with quantity on the y-axis. Interpret and explain your results with the help of this chart. Based on this chart, provide your recommendations to the top management MONTHOOD SUMED Sheet1 Jun Sebrary AR 32 SE Quantity SUMQ SUMO 1 0 301 ME FEED TO Ix- BIF Entire View - 9P Show Me il Columns MONTHOrder Dat YEAR Order Date) Row SUMO SUMQuantity) Sheet1 Inary February March April May Order Date June July August September October November December BK 7K YK GK 5X AK BK 2x 1