

Answered step by step
Verified Expert Solution
Question
1 Approved Answer
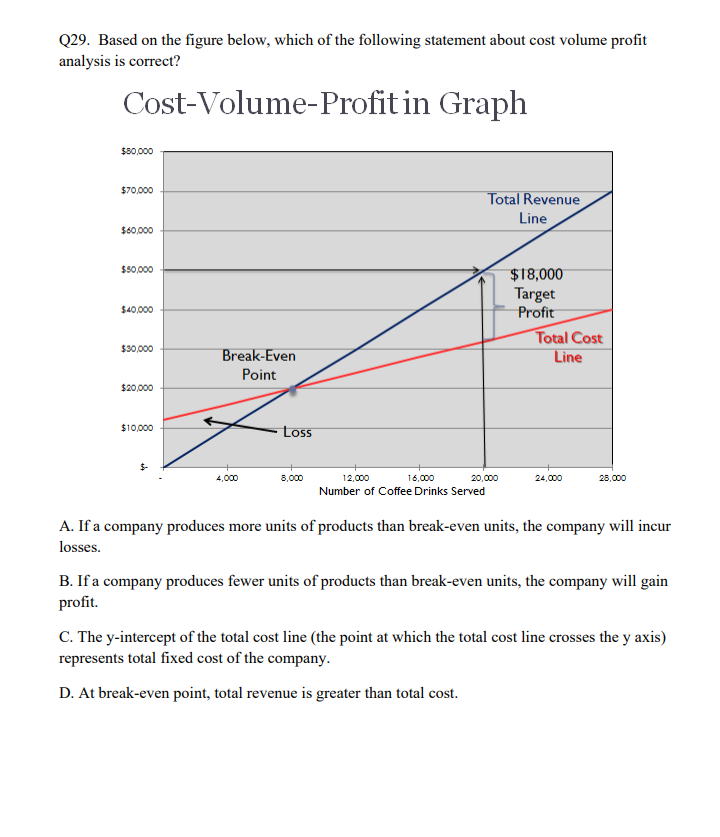
Q29. Based on the figure below, which of the following statement about cost volume profit analysis is correct? Cost-Volume-Profit in Graph $80,000 $70,000 Total Revenue
Step by Step Solution
There are 3 Steps involved in it
Step: 1

Get Instant Access to Expert-Tailored Solutions
See step-by-step solutions with expert insights and AI powered tools for academic success
Step: 2

Step: 3
Ace Your Homework with AI
Get the answers you need in no time with our AI-driven, step-by-step assistance
Get Started
Mastering Management System Auditing The Essential Guide To Effective Auditing Practices
Authors: Ashar Hasan
1st Edition
B0C47RGBVM, 979-8393399023