Question 1 7. Computing real exchange rates Suppose a fixed basket of consumer goods that costs 72 in the United States costs MXN 224 in
Question 1
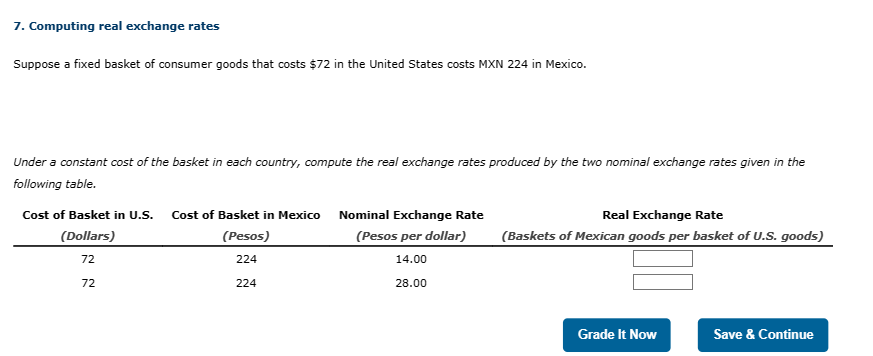
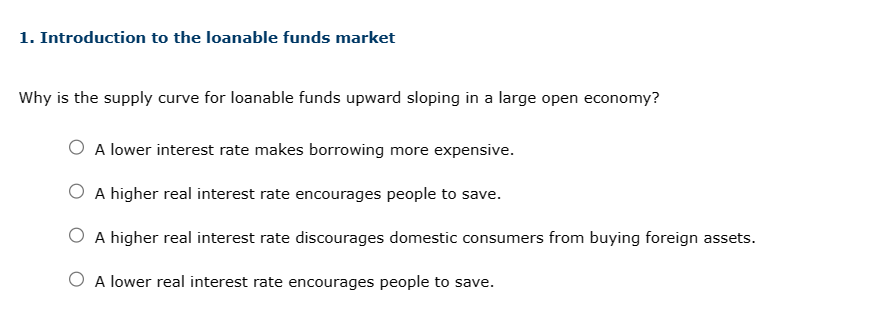
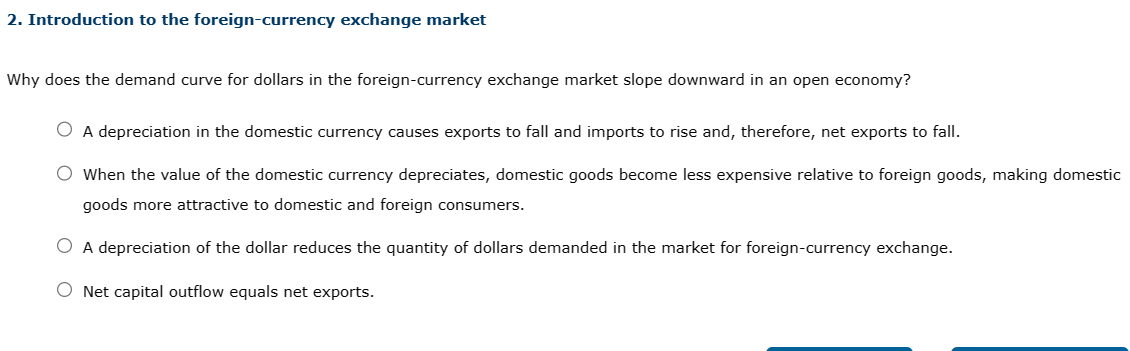
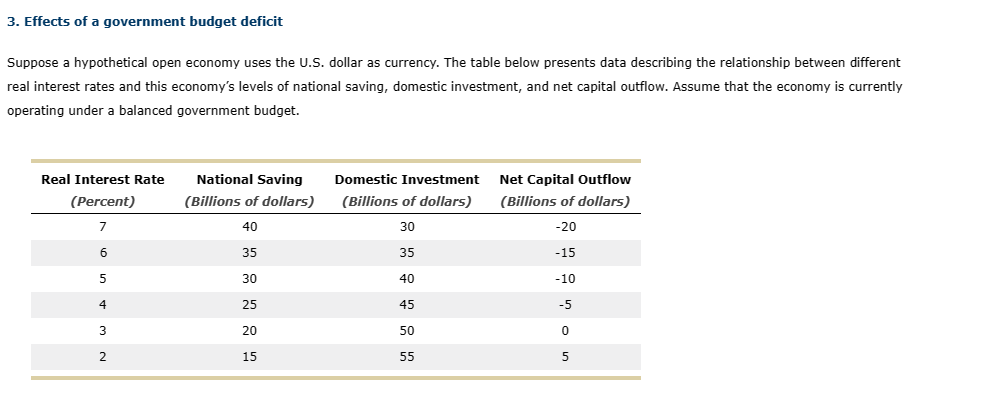
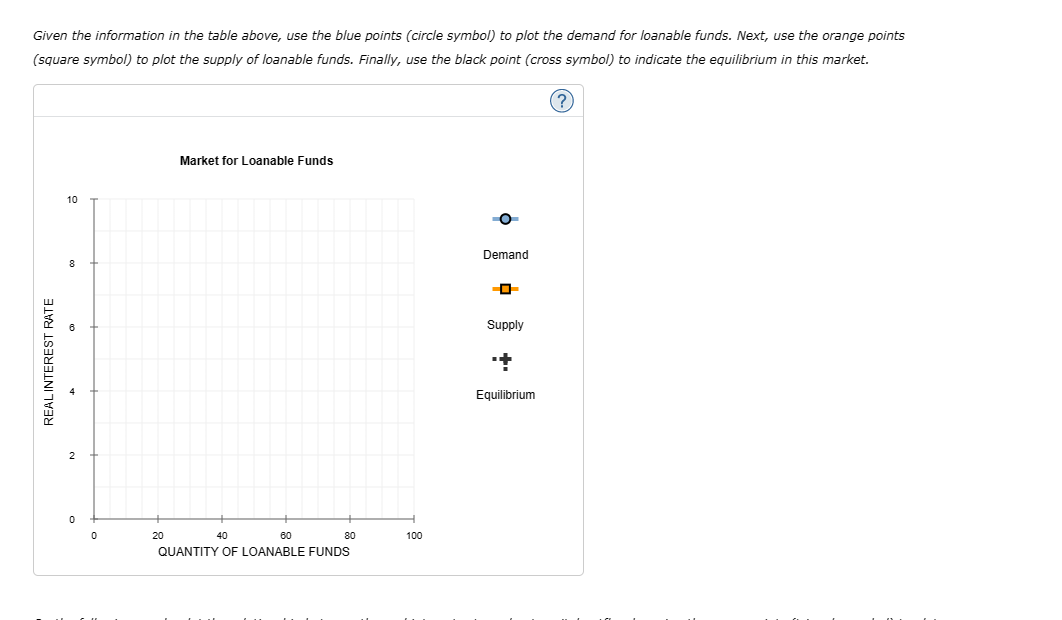
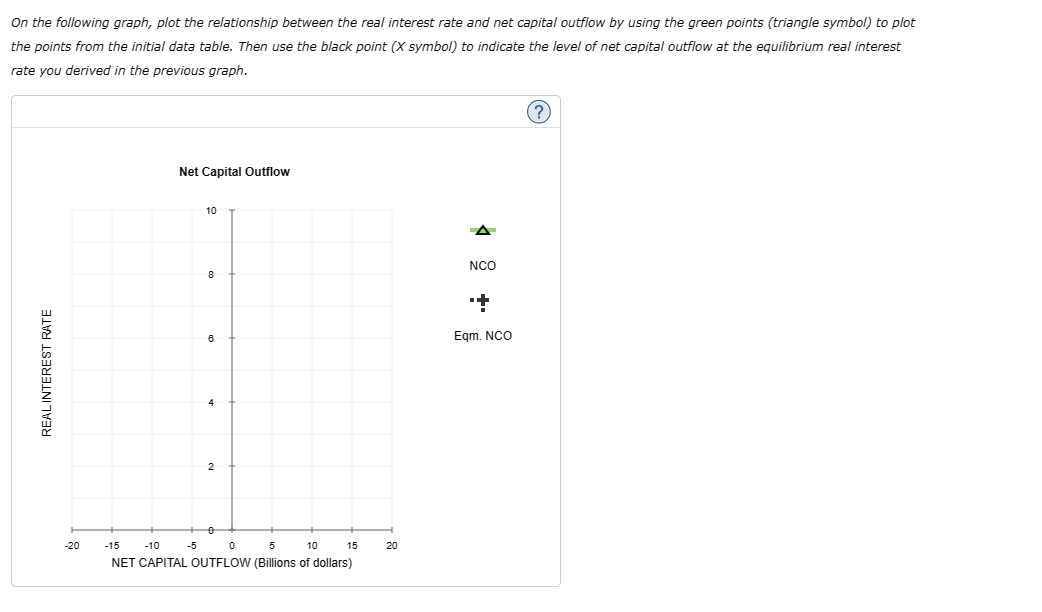
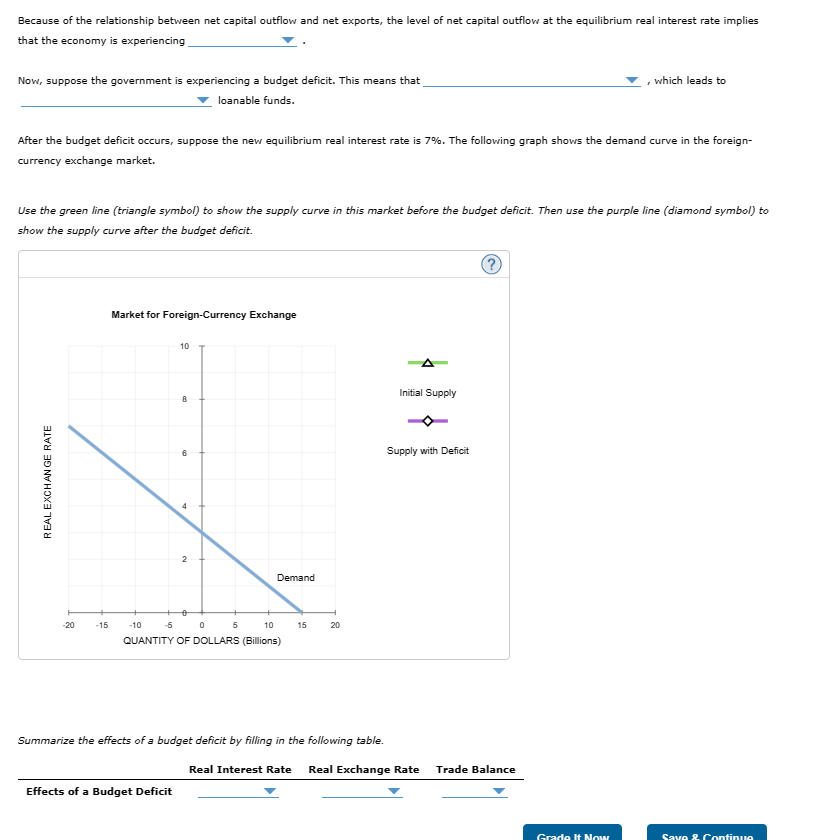
7. Computing real exchange rates Suppose a fixed basket of consumer goods that costs 72 in the United States costs MXN 224 in Mexico. Under a constant cost of the basket in each country, compute the real exchange rates produced by the two nominal exchange rates given in the following table. Cost of Basket in U.S. Cost of Basket in Mexico MNominal Exchange Rate Real Exchange Rate (Dollars) (Pesos) (Pesos per dollar) (Baskets of Mexican goods per basket of U.5. goods) 72 224 14.00 72 224 28.00 1. Introduction to the loanable funds market Why is the supply curve for loanable funds upward sloping in a large open economy? O A lower interest rate makes borrowing more expensive. O A higher real interest rate encourages people to save. O A higher real interest rate discourages domestic consumers from buying foreign assets. O A lower real interest rate encourages people to save. 2. Introduction to the foreign-currency exchange market Why does the demand curve for dollars in the foreign-currency exchange market slope downward in an open economy? O A depreciation in the domestic currency causes exports to fall and imports to rise and, therefore, net exports to fall. O When the value of the domestic currency depreciates, domestic goods become less expensive relative to foreign goods, making domestic goods more attractive to domestic and foreign consumers. O A depreciation of the dollar reduces the quantity of dollars demanded in the market for foreign-currency exchange. O Net capital outflow equals net exports. 3. Effects of a government budget deficit Suppose a hypothetical open economy uses the U.S. dollar as currency. The table below presents data describing the relationship between different real interest rates and this economy's levels of national saving, domestic investment, and net capital outflow. Assume that the economy is currently operating under a balanced government budget. Real Interest Rate National Saving Domestic Investment Net Capital Outflow (Percent) (Billions of dollars) (Billions of dollars) (Billions of dollars) 7 40 30 -20 6 35 35 -15 5 30 40 -10 4 25 45 -5 3 20 50 0 2 15 55 5 Given the information in the table above, use the blue points (circle symbol) to plot the demand for loanable funds. Next, use the orange points (square symbol) to plot the supply of loanable funds. Finally, use the black point (cross symbol) to indicate the equilibrium in this market. Market for Loanable Funds Demand o g - Supply * 4 1 Equilibrium REALINTEREST RATE o 20 40 60 a0 100 QUANTITY OF LOANABLE FUNDS On the following graph, plot the relationship between the real interest rate and net capital outflow by using the green points (triangle symbol) to plot the points from the initial data table. Then use the black point (X symbol) to indicate the level of net capital outflow at the equilibrium real interest rate you derived in the previous graph. Net Capital Outflow 10 A NCO 8 + 6 Eqm. NCO REAL INTEREST RATE 4 2 -20 -15 -10 -5 0 5 10 15 20 NET CAPITAL OUTFLOW (Billions of dollars)Because of the relationship between net capital outflow and net exports, the level of net capital outflow at the equilibrium real interest rate implies that the economy is experiencing Now, suppose the government is experiencing a budget deficit. This means that , which leads to loanable funds. After the budget deficit occurs, suppose the new equilibrium real interest rate is 7%. The following graph shows the demand curve in the foreign- currency exchange market. Use the green line (triangle symbol) to show the supply curve in this market before the budget deficit. Then use the purple line (diamond symbol) to show the supply curve after the budget deficit. (?) Market for Foreign-Currency Exchange 10 Initial Supply Supply with Deficit REAL EXCHANGE RATE Demand 20 -15 -10 10 15 20 QUANTITY OF DOLLARS (Billions) Summarize the effects of a budget deficit by filling in the following table. Real Interest Rate Real Exchange Rate Trade Balance Effects of a Budget Deficit
Step by Step Solution
There are 3 Steps involved in it
Step: 1
Get Instant Access to Expert-Tailored Solutions
See step-by-step solutions with expert insights and AI powered tools for academic success
Step: 2
Step: 3
Ace Your Homework with AI
Get the answers you need in no time with our AI-driven, step-by-step assistance