

Question
Question 1 From page 1 of Purple Teams performance report, you can see that Purple Team maximized their portfolio duration to be 4.75 years on
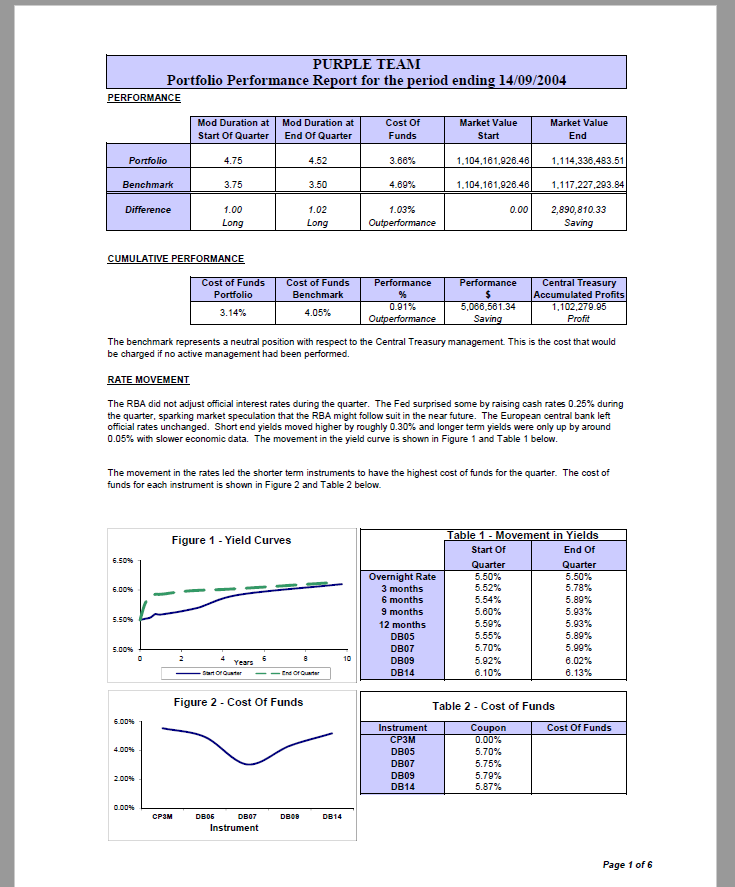 Question 1 From page 1 of Purple Teams performance report, you can see that Purple Team maximized their portfolio duration to be 4.75 years on 15th June 2004. Purple Team also had an outperformance of 1.03% relative to the benchmark for the quarter ending 14th September 2004. Is maximizing portfolio duration the most important reason for Purple Teams outperformance? In other words, if another team, say, Mauve Team, did not maximize their portfolio on 15th June 2004, is it possible for Mauve Team to outperform Purple Team for the quarter ending 14th September 2004? Clearly explain your answer.
Question 2 From page 1 of Purple Teams performance report, you can see Table 2 - Cost of Funds. Coupons for all the bonds are paid semi-annually, in March and September. Assume a face value of $1mil for all the bonds, and all the bonds mature in the month of March (e.g. DB07 matures in March 2007). Required: a) What is the annualized cost of funds for CP3M for the quarter which ends in September 2004? No calculation is required.
b) What is the annualized cost of funds for DB05 for the quarter which ends in September 2004? Clearly show all your workings. Without correct workings, even if the final answer was correct, no marks would be allocated.
c) What is the annualized cost of funds for DB07 for the quarter which ends in September 2004? Without correct workings, even if the final answer was correct, no marks would be allocated.
PURPLE TEAM Portfolio Performance Report for the period ending 14/09/2004 PERFORMANCE Mod Duration at Mod Duration at Cost Of Market Value Market Value Start Of Quarter End Of Quarter Funds Start End Portfolio 4.75 4.52 3.68% 1,104,161,026,46 1.114,338,483.51 Benchmark 3.75 3.50 4.69% 1,104,161,926.46 1.117.227.293.84 Difference 1.00 1.02 1.03% 0.00 2,890,810.33 Saving Long Long Outperformance CUMULATIVE PERFORMANCE Performance Cost of Funds Portfolio Cost of Funds Benchmark Performance $ 5,086.581.34 Saving Central Treasury Accumulated Profits 1,102,279.85 Profit 3.14% 0.91% Outperformance 4.05% The benchmark represents a neutral position with respect to the Central Treasury management. This is the cost that would be charged if no active management had been performed. RATE MOVEMENT The RBA did not adjust official interest rates during the quarter. The Fed surprised some by raising cash rates 0.25% during the quarter, sparking market speculation that the RBA might follow suit in the near future. The European central bank left official rates unchanged. Short end yields moved higher by roughly 0.30% and longer term yields were only up by around 0.05% with slower economic data. The movement in the yield curve is shown in Figure 1 and Table 1 below. The movement in the rates led the shorter term instruments to have the highest cost of funds for the quarter. The cost of funds for each instrument is shown in Figure 2 and Table 2 below. Table 1 - Movement in Yields Figure 1 - Yield Curves Start Of End Of 6.SON Overnight Rate 3 months Quarter 5.50% 5.52% Quarter 5.50% 5.78% 6.00% 6 months 5.54% 5.89% 9 months 5.60% 5.93% 5.50% 12 months 5.50% 5.93% 5.89% DB05 DB07 5.55% 5.70% 5.00% 5.99% 10 Years DB09 5.92% 6.02% Santoranter Ene Orte DB14 6.10% 6.13% Figure 2 - Cost Of Funds Table 2 - Cost of Funds 6.00% Cost Of Funds Instrument CP3M Coupon 0.00% 5.70% 5.75% DB05 DB07 2.00% DB09 DB14 5.79% 5.87% 0.00% CPSM DBOG DB07 DBOB DB14 Instrument Page 1 of 6 PURPLE TEAM Portfolio Performance Report for the period ending 14/09/2004 PERFORMANCE Mod Duration at Mod Duration at Cost Of Market Value Market Value Start Of Quarter End Of Quarter Funds Start End Portfolio 4.75 4.52 3.68% 1,104,161,026,46 1.114,338,483.51 Benchmark 3.75 3.50 4.69% 1,104,161,926.46 1.117.227.293.84 Difference 1.00 1.02 1.03% 0.00 2,890,810.33 Saving Long Long Outperformance CUMULATIVE PERFORMANCE Performance Cost of Funds Portfolio Cost of Funds Benchmark Performance $ 5,086.581.34 Saving Central Treasury Accumulated Profits 1,102,279.85 Profit 3.14% 0.91% Outperformance 4.05% The benchmark represents a neutral position with respect to the Central Treasury management. This is the cost that would be charged if no active management had been performed. RATE MOVEMENT The RBA did not adjust official interest rates during the quarter. The Fed surprised some by raising cash rates 0.25% during the quarter, sparking market speculation that the RBA might follow suit in the near future. The European central bank left official rates unchanged. Short end yields moved higher by roughly 0.30% and longer term yields were only up by around 0.05% with slower economic data. The movement in the yield curve is shown in Figure 1 and Table 1 below. The movement in the rates led the shorter term instruments to have the highest cost of funds for the quarter. The cost of funds for each instrument is shown in Figure 2 and Table 2 below. Table 1 - Movement in Yields Figure 1 - Yield Curves Start Of End Of 6.SON Overnight Rate 3 months Quarter 5.50% 5.52% Quarter 5.50% 5.78% 6.00% 6 months 5.54% 5.89% 9 months 5.60% 5.93% 5.50% 12 months 5.50% 5.93% 5.89% DB05 DB07 5.55% 5.70% 5.00% 5.99% 10 Years DB09 5.92% 6.02% Santoranter Ene Orte DB14 6.10% 6.13% Figure 2 - Cost Of Funds Table 2 - Cost of Funds 6.00% Cost Of Funds Instrument CP3M Coupon 0.00% 5.70% 5.75% DB05 DB07 2.00% DB09 DB14 5.79% 5.87% 0.00% CPSM DBOG DB07 DBOB DB14 Instrument Page 1 of 6
Step by Step Solution
There are 3 Steps involved in it
Step: 1

Get Instant Access to Expert-Tailored Solutions
See step-by-step solutions with expert insights and AI powered tools for academic success
Step: 2

Step: 3
Ace Your Homework with AI
Get the answers you need in no time with our AI-driven, step-by-step assistance
Get Started
Trade Union Finance
Authors: Marick F. Masters, Raymond Gibney
1st Edition
1032371382, 978-1032371382