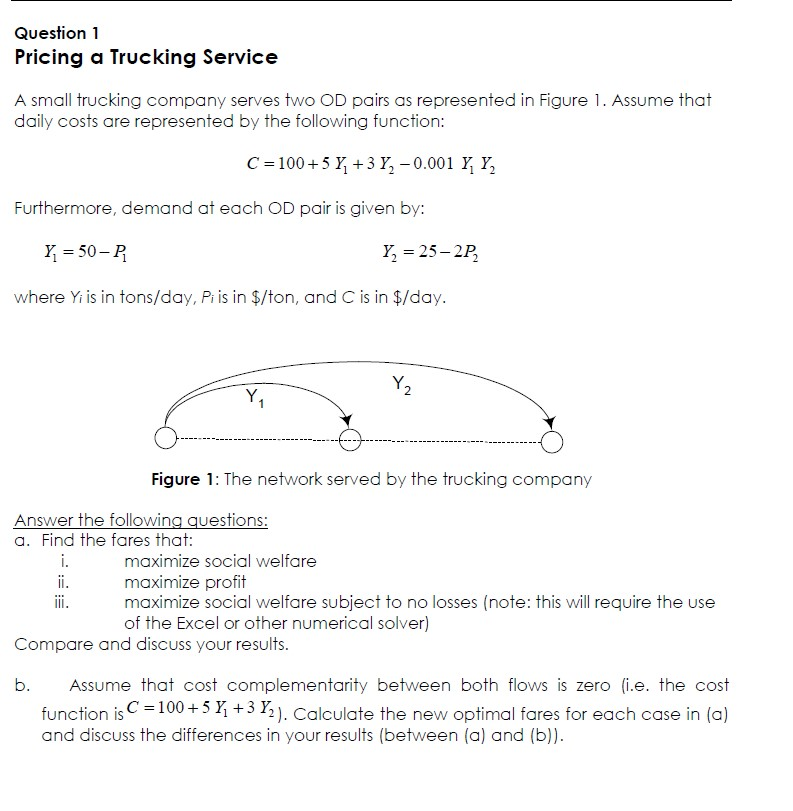
Question 1 Pricing a Trucking Service A small trucking company serves two OD pairs as represented in Figure 1. Assume that daily costs are represented by the following function: C = 100+ 5 Y, +3Y, -0.001 Y, Y, Furthermore, demand at each OD pair is given by: Y = 50-P Y, = 25-2P, where Yi is in tons/day, Pi is in $/ton, and C is in $/day. Y Y Figure 1: The network served by the trucking company Answer the following questions: a. Find the fares that: i. maximize social welfare ii. maximize profit ii. maximize social welfare subject to no losses (note: this will require the use of the Excel or other numerical solver) Compare and discuss your results. b. Assume that cost complementarity between both flows is zero i.e. the cost function is C = 100 + 5 Y+3 Y2). Calculate the new optimal fares for each case in (a) and discuss the differences in your results (between (a) and (b)). Question 2 The Use of Pricing to Control Flow on Urban Expressways Travel on urban expressways can be described by the following simple linear relationship between the actual speed at which traffic flows (s, measured in miles per hour) and the flow of traffic (Q, measured in vehicles per hour in each traffic lane): S = So-aQ where So represents the speed at which vehicles would travel under uncrowded conditions if there were no speed limit, and a is a parameter of the relationship. The Highway Capacity Manual suggests values of 70 miles per hour for So and 0.015 for a. These values are quite close to those estimated from actual traffic speed and flow data for urban expressways in California, which are So=74.7 miles per hour and a=0.0169. Answer the following questions: a. Using the estimated California values for so and a, and assuming that the fixed operation expenses for a typical automobile total 20 cents per mile, derive an expression for the average private cost per mile of operating an automobile on an urban expressway when the auto is occupied by n persons, each valuing travel time at V dollars per hour. Compute and plot this cost for a range of traffic flows from o to 2000 cars per lane per hour, using n = 1.4 and V = $10.00 per hour. b. Using the same assumptions, write an equation for the marginal social cost imposed by each vehicle using the facility, defined as the change in the total private costs incurred by all travelers on the road when an additional vehicle enters the flow. (Total private costs are the product of average private cost per vehicle and the number of vehicles in the flow, Q.) Compute and plot this cost over the same range of traffic flows as in part (a) above, again using the values n = 1.4 and V = $10.00 per hour. C. Suppose an urban expressway characterized by these cost functions initially experiences flows of 2000 cars per lane per hour during the peak travel hours. How large is the "external" cost per mile that is imposed on other travelers by each automobile using the facility? How large is it as a proportion of the costs that are privately borne by each vehicle? If automobiles average 20 miles per gallon of fuel, how does it compare to 36 cents per gallon in federal and state gasoline taxes d. Answer the following: i. Based on your calculations in (c), what is the toll that should be charged by the government for use of the road ii. If the elasticity of demand for travel on this facility during the peak hours with respect to the cost of doing so is -0.2, what flow would results from a policy of charging motorists this toll? How fast would vehicles travel at this new flow? What is the toll that should be charged at the new flow? Are motorists over-charged? iv. Compute the equilibrium optimal toll, taking into consideration the demand change in response to the toll. ill. 2 Question 1 Pricing a Trucking Service A small trucking company serves two OD pairs as represented in Figure 1. Assume that daily costs are represented by the following function: C = 100+ 5 Y, +3Y, -0.001 Y, Y, Furthermore, demand at each OD pair is given by: Y = 50-P Y, = 25-2P, where Yi is in tons/day, Pi is in $/ton, and C is in $/day. Y Y Figure 1: The network served by the trucking company Answer the following questions: a. Find the fares that: i. maximize social welfare ii. maximize profit ii. maximize social welfare subject to no losses (note: this will require the use of the Excel or other numerical solver) Compare and discuss your results. b. Assume that cost complementarity between both flows is zero i.e. the cost function is C = 100 + 5 Y+3 Y2). Calculate the new optimal fares for each case in (a) and discuss the differences in your results (between (a) and (b)). Question 2 The Use of Pricing to Control Flow on Urban Expressways Travel on urban expressways can be described by the following simple linear relationship between the actual speed at which traffic flows (s, measured in miles per hour) and the flow of traffic (Q, measured in vehicles per hour in each traffic lane): S = So-aQ where So represents the speed at which vehicles would travel under uncrowded conditions if there were no speed limit, and a is a parameter of the relationship. The Highway Capacity Manual suggests values of 70 miles per hour for So and 0.015 for a. These values are quite close to those estimated from actual traffic speed and flow data for urban expressways in California, which are So=74.7 miles per hour and a=0.0169. Answer the following questions: a. Using the estimated California values for so and a, and assuming that the fixed operation expenses for a typical automobile total 20 cents per mile, derive an expression for the average private cost per mile of operating an automobile on an urban expressway when the auto is occupied by n persons, each valuing travel time at V dollars per hour. Compute and plot this cost for a range of traffic flows from o to 2000 cars per lane per hour, using n = 1.4 and V = $10.00 per hour. b. Using the same assumptions, write an equation for the marginal social cost imposed by each vehicle using the facility, defined as the change in the total private costs incurred by all travelers on the road when an additional vehicle enters the flow. (Total private costs are the product of average private cost per vehicle and the number of vehicles in the flow, Q.) Compute and plot this cost over the same range of traffic flows as in part (a) above, again using the values n = 1.4 and V = $10.00 per hour. C. Suppose an urban expressway characterized by these cost functions initially experiences flows of 2000 cars per lane per hour during the peak travel hours. How large is the "external" cost per mile that is imposed on other travelers by each automobile using the facility? How large is it as a proportion of the costs that are privately borne by each vehicle? If automobiles average 20 miles per gallon of fuel, how does it compare to 36 cents per gallon in federal and state gasoline taxes d. Answer the following: i. Based on your calculations in (c), what is the toll that should be charged by the government for use of the road ii. If the elasticity of demand for travel on this facility during the peak hours with respect to the cost of doing so is -0.2, what flow would results from a policy of charging motorists this toll? How fast would vehicles travel at this new flow? What is the toll that should be charged at the new flow? Are motorists over-charged? iv. Compute the equilibrium optimal toll, taking into consideration the demand change in response to the toll. ill. 2