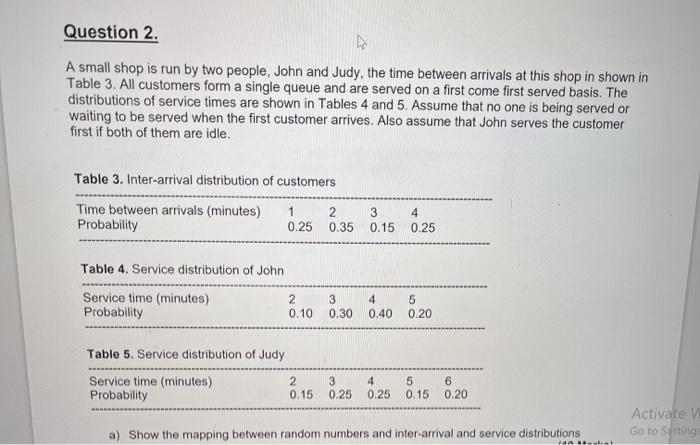
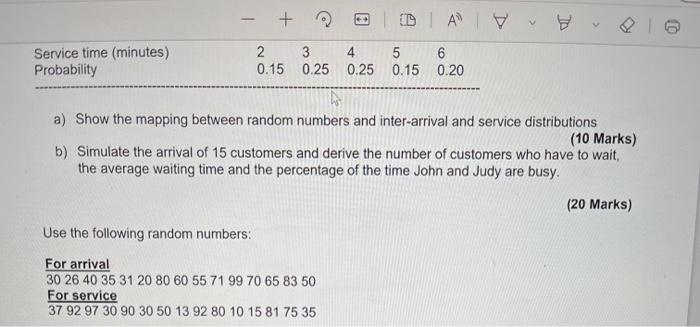
Question 2. A small shop is run by two people, John and Judy, the time between arrivals at this shop in shown Table 3. All customers form a single queue and are served on a first come first served basis. The distributions of service times are shown in Tables 4 and 5. Assume that no one is being served or waiting to be served when the first customer arrives. Also assume that John serves the customer first if both of them are idle. Table 3. Inter-arrival distribution of customers Time between arrivals (minutes) 1 2 Probability 0.25 0.35 3 0.15 4 0.25 Table 4. Service distribution of John Service time (minutes) 2 Probability 0.10 3 0.30 4 0.40 5 0.20 Table 5. Service distribution of Judy Service time (minutes) 2 Probability 0.15 6 3 0.25 4 0.25 5 0.15 Activate Go to Song a) Show the mapping between random numbers and inter-arrival and service distributions. + 2 DA Service time (minutes) Probability 2 3 4 5 6 0.15 0.25 0.25 0.15 0.20 a) Show the mapping between random numbers and inter-arrival and service distributions (10 Marks) b) Simulate the arrival of 15 customers and derive the number of customers who have to wait, the average waiting time and the percentage of the time John and Judy are busy. (20 Marks) Use the following random numbers: For arrival 30 26 40 35 31 20 80 60 55 71 99 70 65 83 50 For service 37 92 97 30 90 30 50 13 92 80 10 15 81 75 35 Question 2. A small shop is run by two people, John and Judy, the time between arrivals at this shop in shown Table 3. All customers form a single queue and are served on a first come first served basis. The distributions of service times are shown in Tables 4 and 5. Assume that no one is being served or waiting to be served when the first customer arrives. Also assume that John serves the customer first if both of them are idle. Table 3. Inter-arrival distribution of customers Time between arrivals (minutes) 1 2 Probability 0.25 0.35 3 0.15 4 0.25 Table 4. Service distribution of John Service time (minutes) 2 Probability 0.10 3 0.30 4 0.40 5 0.20 Table 5. Service distribution of Judy Service time (minutes) 2 Probability 0.15 6 3 0.25 4 0.25 5 0.15 Activate Go to Song a) Show the mapping between random numbers and inter-arrival and service distributions. + 2 DA Service time (minutes) Probability 2 3 4 5 6 0.15 0.25 0.25 0.15 0.20 a) Show the mapping between random numbers and inter-arrival and service distributions (10 Marks) b) Simulate the arrival of 15 customers and derive the number of customers who have to wait, the average waiting time and the percentage of the time John and Judy are busy. (20 Marks) Use the following random numbers: For arrival 30 26 40 35 31 20 80 60 55 71 99 70 65 83 50 For service 37 92 97 30 90 30 50 13 92 80 10 15 81 75 35


