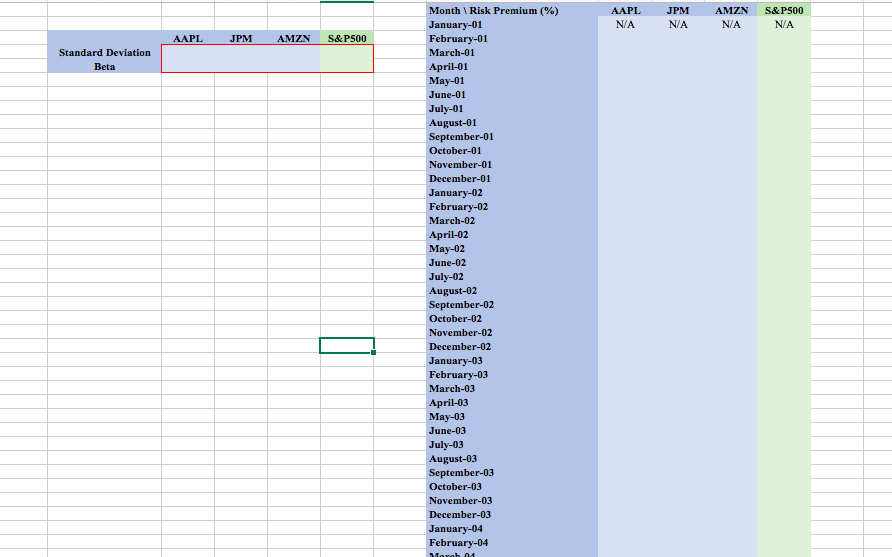
Question 2 Excel Please Show me how to input formula


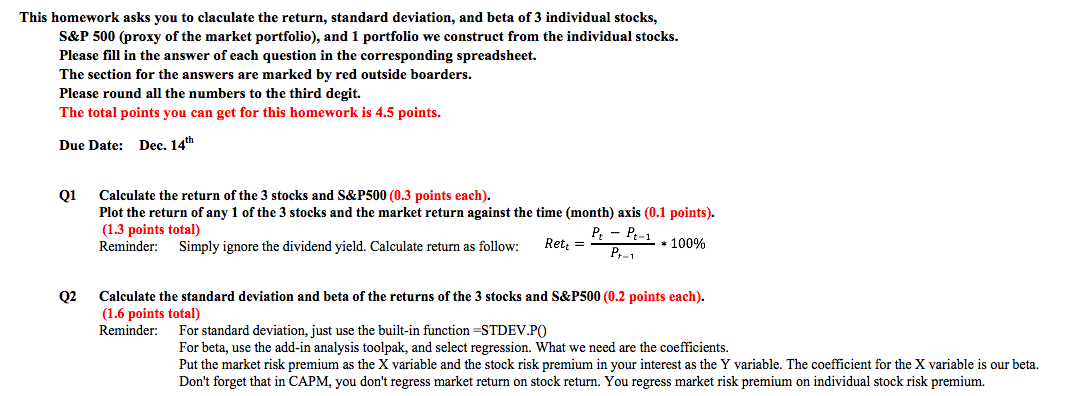
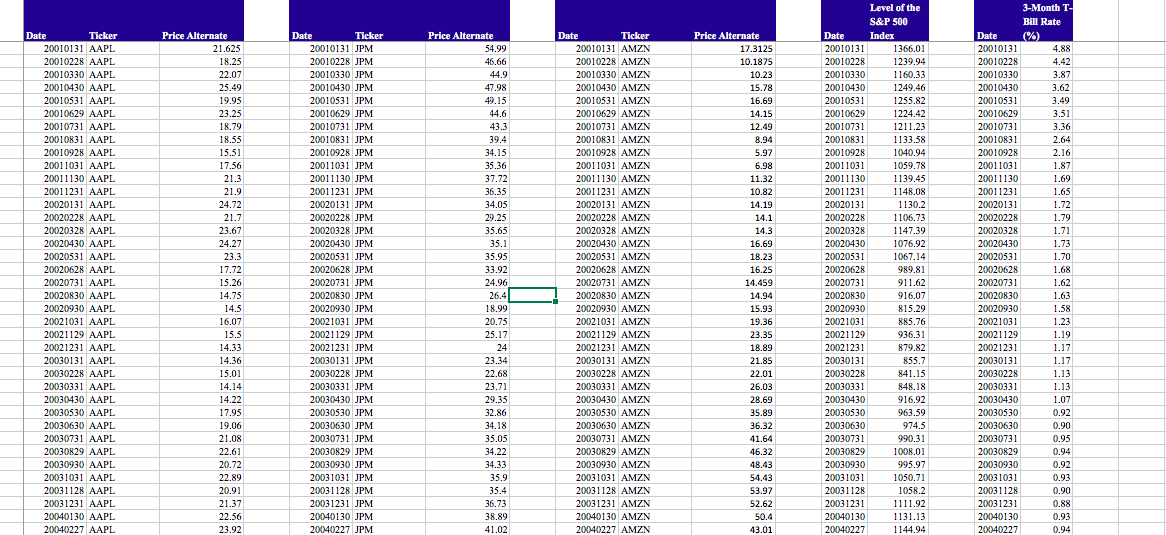
This homework asks you to claculate the return, standard deviation, and beta of 3 individual stocks, S&P 500 (proxy of the market portfolio), and 1 portfolio we construct from the individual stocks. Please fill in the answer of each question in the corresponding spreadsheet. The section for the answers are marked by red outside boarders. Please round all the numbers to the third degit. The total points you can get for this homework is 4.5 points. Due Date: Dec. 14th Q1 Calculate the return of the 3 stocks and S&P500 (0.3 points each). Plot the return of any 1 of the 3 stocks and the market return against the time (month) axis (0.1 points). (1.3 points total) Reminder: Simply ignore the dividend yield. Calculate return as follow: Rett = P: - P4-1 . 100% Q2 Calculate the standard deviation and beta of the returns of the 3 stocks and S&P500 (0.2 points each). (1.6 points total) Reminder: For standard deviation, just use the built-in function=STDEV.PO For beta, use the add-in analysis toolpak, and select regression. What we need are the coefficients. Put the market risk premium as the X variable and the stock risk premium in your interest as the Y variable. The coefficient for the X variable is our beta. Don't forget that in CAPM, you don't regress market return on stock return. You regress market risk premium on individual stock risk premium. Price Alternate 17.3125 10.1875 10.23 15.78 16.69 14.15 12.49 8.94 5.97 6.98 11.32 10.82 14.19 Date Ticker 20010131 AAPL 20010228 AAPL 20010330 AAPL 20010430 AAPL 20010531 AAPL 20010629 AAPL 20010731 AAPL 20010831 AAPL 20010928 AAPL 20011031 AAPL 20011130 AAPL 20011231 AAPL 20020131 AAPL 20020228 AAPL 20020328 AAPL 20020430 AAPL 20020531 AAPL 20020628 AAPL 20020731 AAPL 20020830 AAPL 20020930 AAPL 20021031 AAPL 20021129 AAPL 20021231 AAPL 20030131 AAPL 20030228 AAPL 20030331 AAPL 20030430 AAPL 20030530 AAPL 20030630 AAPL 20030731 AAPL 20030829 AAPL 20030930 AAPL 20031031 AAPL 20031128 AAPL 20031231 AAPL 20040130 AAPL 20040227 AAPL 14.1 Price Alternate 21.625 18.25 22.07 25.49 19.95 23.25 18.79 18.55 15.51 17.56 21.3 21.9 24.72 21.7 23.67 24.27 23.3 17.72 15.26 14.75 14.5 16.07 15.5 14.33 14.36 15.01 14.14 14.22 17.95 19.06 21.08 22.61 20.72 22.89 20.91 21.37 22.56 23.92 Price Alternate 54.99 46.66 44.9 47.98 49.15 44.6 43.3 39.4 34.15 35.36 37.72 36.35 34.05 29.25 35.65 35.1 35.95 33.92 24.96 26.4 18.99 20.75 25.17 Ticker 20010131 JPM 20010228 JPM 20010330 JPM 20010430 JPM 20010531 JPM 20010629 JPM 20010731 JPM 20010831 JPM 20010928 JPM 20011031 JPM 20011130 JPM 20011231 JPM 20020131 JPM 20020228 JPM 20020328 JPM 20020430 JPM 20020531 JPM 20020628 JPM 20020731 JPM 20020830 JPM 20020930 JPM 20021031 JPM 20021129 JPM 20021231 JPM 20030131 JPM 20030228 JPM 20030331 JPM 20030430 JPM 20030530 JPM 20030630 JPM 20030731 JPM 20030829 JPM 20030930 JPM 20031031 JPM 20031128 JPM 20031231 JPM 20040130 JPM 20040227 JPM Date Ticker 20010131 AMZN 20010228 AMZN 20010330 AMZN 20010430 AMZN 20010531 AMZN 20010629 AMZN 20010731 AMZN 20010831 AMZN 20010928 AMZN 20011031 AMZN 20011130 AMZN 20011231 AMZN 20020131 AMZN 20020228 AMZN 20020328 AMZN 20020430 AMZN 20020531 AMZN 20020628 AMZN 20020731 AMZN 20020830 AMZN 20020930 AMZN 20021031 AMZN 20021129 AMZN 20021231 AMZN 20030131 AMZN 20030228 AMZN 20030331 AMZN 20030430 AMZN 20030530 AMZN 20030630 AMZN 20030731 AMZN 20030829 AMZN 20030930 AMZN 20031031 AMZN 20031128 AMZN 20031231 AMZN 20040130 AMZN 20040227 AMZN Level of the S&P 500 Date Index 20010131 1366.01 20010228 1239.94 20010330 1160.33 20010430 1249.46 20010531 1255.82 20010629 1224.42 20010731 1211.23 20010831 1133.58 20010928 1040.94 20011031 1059.78 20011130 1139.45 20011231 1148.08 20020131 1 130.2 20020228 1106.73 20020328 1147.39 20020430 1076.92 20020531 1067.14 20020628 989.81 20020731 911.62 20020830 916.07 20020930 815.29 20021031 885.76 20021129 936.31 20021231 879.82 20030131 855.7 20030228 841.15 20030331 848.18 20030430 916.92 20030530 963.59 20030630 974.5 20030731 990.31 20030829 1008.01 20030930 995.97 20031031 1050.71 20031128 10582 20031231 1111.92 20040130 1131.13 20040227 1144.94 3-Month T- Bill Rate Date (%) 20010131 4.88 20010228 4.42 20010330 3.87 20010430 3.62 20010531 3.49 20010629 3.51 20010731 3.36 20010831 2.64 20010928 2.16 20011031 1.87 20011130 1.69 20011231 165 20020131 1.72 20020228 1.79 20020328 1.71 20020430 1.73 20020531 1.70 20020628 1.68 20020731 1.62 20020830 20020930 1.58 20021031 1.23 20021129 1.19 20021231 1.17 20030131 1.17 20030228 1.13 20030331 1.13 20030430 1.07 20030530 0.92 20030630 0.90 20030731 0.95 20030829 0.94 20030930 0.92 20031031 0.93 20031128 0.90 20031231 0.88 20040130 0.93 20040227 0.94 14.3 16.69 18.23 16.25 14,459 14.94 15.93 19.36 23.35 18.89 21.85 22.01 26.03 28.69 35.89 36.32 41.64 46.32 48.43 54.43 53.97 52.62 50.4 43.01 1.63 23.34 22.68 23.71 29.35 32.86 34.18 35.05 34.22 34.33 35.9 35.4 36.73 38.89 41.02 AAPL N/A JPM N/A AMZN N/A S&P500 N/A AAPL JPM AMZN S&P500 Standard Deviation Beta Month Risk Premium (%) January-01 February-01 March-01 April-01 May-01 June-01 July-01 August-01 September-01 October-01 November-01 December-01 January-02 February-02 March-02 April-02 May-02 June-02 July-02 August-02 September-02 October-02 November-02 December-02 January-03 February-03 March-03 April-03 May-03 June-03 July-03 August-03 September-03 October-03 November-03 December-03 January-04 February-04 Movab This homework asks you to claculate the return, standard deviation, and beta of 3 individual stocks, S&P 500 (proxy of the market portfolio), and 1 portfolio we construct from the individual stocks. Please fill in the answer of each question in the corresponding spreadsheet. The section for the answers are marked by red outside boarders. Please round all the numbers to the third degit. The total points you can get for this homework is 4.5 points. Due Date: Dec. 14th Q1 Calculate the return of the 3 stocks and S&P500 (0.3 points each). Plot the return of any 1 of the 3 stocks and the market return against the time (month) axis (0.1 points). (1.3 points total) Reminder: Simply ignore the dividend yield. Calculate return as follow: Rett = P: - P4-1 . 100% Q2 Calculate the standard deviation and beta of the returns of the 3 stocks and S&P500 (0.2 points each). (1.6 points total) Reminder: For standard deviation, just use the built-in function=STDEV.PO For beta, use the add-in analysis toolpak, and select regression. What we need are the coefficients. Put the market risk premium as the X variable and the stock risk premium in your interest as the Y variable. The coefficient for the X variable is our beta. Don't forget that in CAPM, you don't regress market return on stock return. You regress market risk premium on individual stock risk premium. Price Alternate 17.3125 10.1875 10.23 15.78 16.69 14.15 12.49 8.94 5.97 6.98 11.32 10.82 14.19 Date Ticker 20010131 AAPL 20010228 AAPL 20010330 AAPL 20010430 AAPL 20010531 AAPL 20010629 AAPL 20010731 AAPL 20010831 AAPL 20010928 AAPL 20011031 AAPL 20011130 AAPL 20011231 AAPL 20020131 AAPL 20020228 AAPL 20020328 AAPL 20020430 AAPL 20020531 AAPL 20020628 AAPL 20020731 AAPL 20020830 AAPL 20020930 AAPL 20021031 AAPL 20021129 AAPL 20021231 AAPL 20030131 AAPL 20030228 AAPL 20030331 AAPL 20030430 AAPL 20030530 AAPL 20030630 AAPL 20030731 AAPL 20030829 AAPL 20030930 AAPL 20031031 AAPL 20031128 AAPL 20031231 AAPL 20040130 AAPL 20040227 AAPL 14.1 Price Alternate 21.625 18.25 22.07 25.49 19.95 23.25 18.79 18.55 15.51 17.56 21.3 21.9 24.72 21.7 23.67 24.27 23.3 17.72 15.26 14.75 14.5 16.07 15.5 14.33 14.36 15.01 14.14 14.22 17.95 19.06 21.08 22.61 20.72 22.89 20.91 21.37 22.56 23.92 Price Alternate 54.99 46.66 44.9 47.98 49.15 44.6 43.3 39.4 34.15 35.36 37.72 36.35 34.05 29.25 35.65 35.1 35.95 33.92 24.96 26.4 18.99 20.75 25.17 Ticker 20010131 JPM 20010228 JPM 20010330 JPM 20010430 JPM 20010531 JPM 20010629 JPM 20010731 JPM 20010831 JPM 20010928 JPM 20011031 JPM 20011130 JPM 20011231 JPM 20020131 JPM 20020228 JPM 20020328 JPM 20020430 JPM 20020531 JPM 20020628 JPM 20020731 JPM 20020830 JPM 20020930 JPM 20021031 JPM 20021129 JPM 20021231 JPM 20030131 JPM 20030228 JPM 20030331 JPM 20030430 JPM 20030530 JPM 20030630 JPM 20030731 JPM 20030829 JPM 20030930 JPM 20031031 JPM 20031128 JPM 20031231 JPM 20040130 JPM 20040227 JPM Date Ticker 20010131 AMZN 20010228 AMZN 20010330 AMZN 20010430 AMZN 20010531 AMZN 20010629 AMZN 20010731 AMZN 20010831 AMZN 20010928 AMZN 20011031 AMZN 20011130 AMZN 20011231 AMZN 20020131 AMZN 20020228 AMZN 20020328 AMZN 20020430 AMZN 20020531 AMZN 20020628 AMZN 20020731 AMZN 20020830 AMZN 20020930 AMZN 20021031 AMZN 20021129 AMZN 20021231 AMZN 20030131 AMZN 20030228 AMZN 20030331 AMZN 20030430 AMZN 20030530 AMZN 20030630 AMZN 20030731 AMZN 20030829 AMZN 20030930 AMZN 20031031 AMZN 20031128 AMZN 20031231 AMZN 20040130 AMZN 20040227 AMZN Level of the S&P 500 Date Index 20010131 1366.01 20010228 1239.94 20010330 1160.33 20010430 1249.46 20010531 1255.82 20010629 1224.42 20010731 1211.23 20010831 1133.58 20010928 1040.94 20011031 1059.78 20011130 1139.45 20011231 1148.08 20020131 1 130.2 20020228 1106.73 20020328 1147.39 20020430 1076.92 20020531 1067.14 20020628 989.81 20020731 911.62 20020830 916.07 20020930 815.29 20021031 885.76 20021129 936.31 20021231 879.82 20030131 855.7 20030228 841.15 20030331 848.18 20030430 916.92 20030530 963.59 20030630 974.5 20030731 990.31 20030829 1008.01 20030930 995.97 20031031 1050.71 20031128 10582 20031231 1111.92 20040130 1131.13 20040227 1144.94 3-Month T- Bill Rate Date (%) 20010131 4.88 20010228 4.42 20010330 3.87 20010430 3.62 20010531 3.49 20010629 3.51 20010731 3.36 20010831 2.64 20010928 2.16 20011031 1.87 20011130 1.69 20011231 165 20020131 1.72 20020228 1.79 20020328 1.71 20020430 1.73 20020531 1.70 20020628 1.68 20020731 1.62 20020830 20020930 1.58 20021031 1.23 20021129 1.19 20021231 1.17 20030131 1.17 20030228 1.13 20030331 1.13 20030430 1.07 20030530 0.92 20030630 0.90 20030731 0.95 20030829 0.94 20030930 0.92 20031031 0.93 20031128 0.90 20031231 0.88 20040130 0.93 20040227 0.94 14.3 16.69 18.23 16.25 14,459 14.94 15.93 19.36 23.35 18.89 21.85 22.01 26.03 28.69 35.89 36.32 41.64 46.32 48.43 54.43 53.97 52.62 50.4 43.01 1.63 23.34 22.68 23.71 29.35 32.86 34.18 35.05 34.22 34.33 35.9 35.4 36.73 38.89 41.02 AAPL N/A JPM N/A AMZN N/A S&P500 N/A AAPL JPM AMZN S&P500 Standard Deviation Beta Month Risk Premium (%) January-01 February-01 March-01 April-01 May-01 June-01 July-01 August-01 September-01 October-01 November-01 December-01 January-02 February-02 March-02 April-02 May-02 June-02 July-02 August-02 September-02 October-02 November-02 December-02 January-03 February-03 March-03 April-03 May-03 June-03 July-03 August-03 September-03 October-03 November-03 December-03 January-04 February-04 Movab


