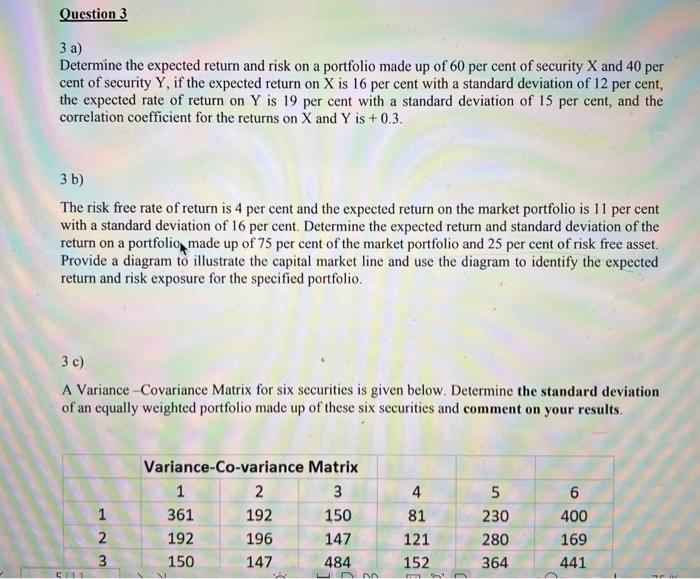
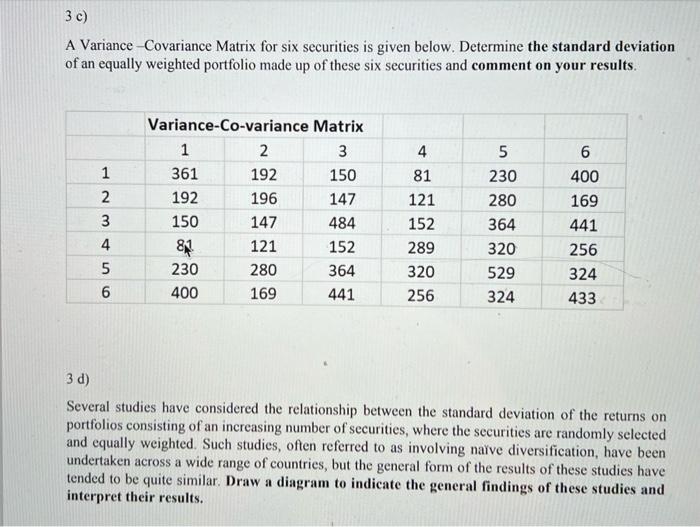
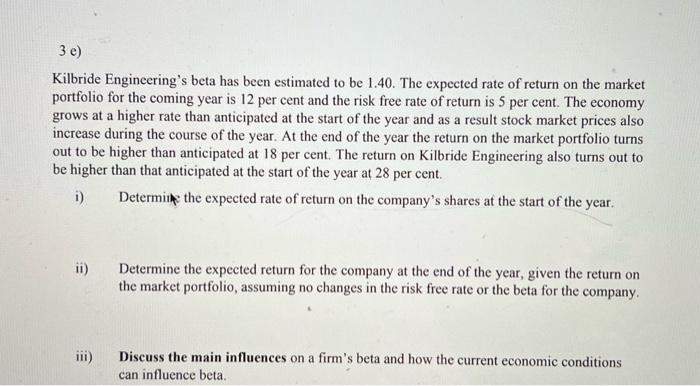
Question 3 3 a) Determine the expected return and risk on a portfolio made up of 60 per cent of security X and 40 per cent of security Y, if the expected return on X is 16 per cent with a standard deviation of 12 per cent, the expected rate of return on Y is 19 per cent with a standard deviation of 15 per cent, and the correlation coefficient for the returns on X and Y is +0.3. 3 b) The risk free rate of return is 4 per cent and the expected return on the market portfolio is 11 per cent with a standard deviation of 16 per cent. Determine the expected return and standard deviation of the return on a portfolio, made up of 75 per cent of the market portfolio and 25 per cent of risk free asset. Provide a diagram to illustrate the capital market line and use the diagram to identify the expected return and risk exposure for the specified portfolio. 3c) A Variance -Covariance Matrix for six securities is given below. Determine the standard deviation of an equally weighted portfolio made up of these six securities and comment on your results. 4 Variance-Co-variance Matrix 1 2. 3 361 192 150 192 196 147 150 147 484 1 2 3 81 5 230 280 364 6 400 169 441 121 152 11 JAN 3c) A Variance Covariance Matrix for six securities is given below. Determine the standard deviation of an equally weighted portfolio made up of these six securities and comment on your results. w NP 1 2 3 4 Variance-Co-variance Matrix 1 2 3 361 192 150 192 196 147 150 147 484 8 121 152 230 280 364 400 169 441 4 81 121 152 289 320 256 5 230 280 364 320 529 324 6 400 169 441 256 324 433 5 6 3d) Several studies have considered the relationship between the standard deviation of the returns on portfolios consisting of an increasing number of securities, where the securities are randomly selected and equally weighted. Such studies, often referred to as involving naive diversification, have been undertaken across a wide range of countries, but the general form of the results of these studies have tended to be quite similar. Draw a diagram to indicate the general findings of these studies and interpret their results. 3 e) Kilbride Engineering's beta has been estimated to be 1.40. The expected rate of return on the market portfolio for the coming year is 12 per cent and the risk free rate of return is 5 per cent. The economy grows at a higher rate than anticipated at the start of the year and as a result stock market prices also increase during the course of the year. At the end of the year the return on the market portfolio turns out to be higher than anticipated at 18 per cent. The return on Kilbride Engineering also turns out to be higher than that anticipated at the start of the year at 28 per cent. i) Determine the expected rate of return on the company's shares at the start of the year. ii) Determine the expected return for the company at the end of the year, given the return on the market portfolio, assuming no changes in the risk free rate or the beta for the company. 111) Discuss the main influences on a firm's beta and how the current economic conditions can influence beta


