

Question: Question #4 7 MIL DEC '07 ***** JOB LOSS BY QUARTER 9 MIL SEPT '08 ******: **** 13.5 MIL MAR '09 15 MIL +
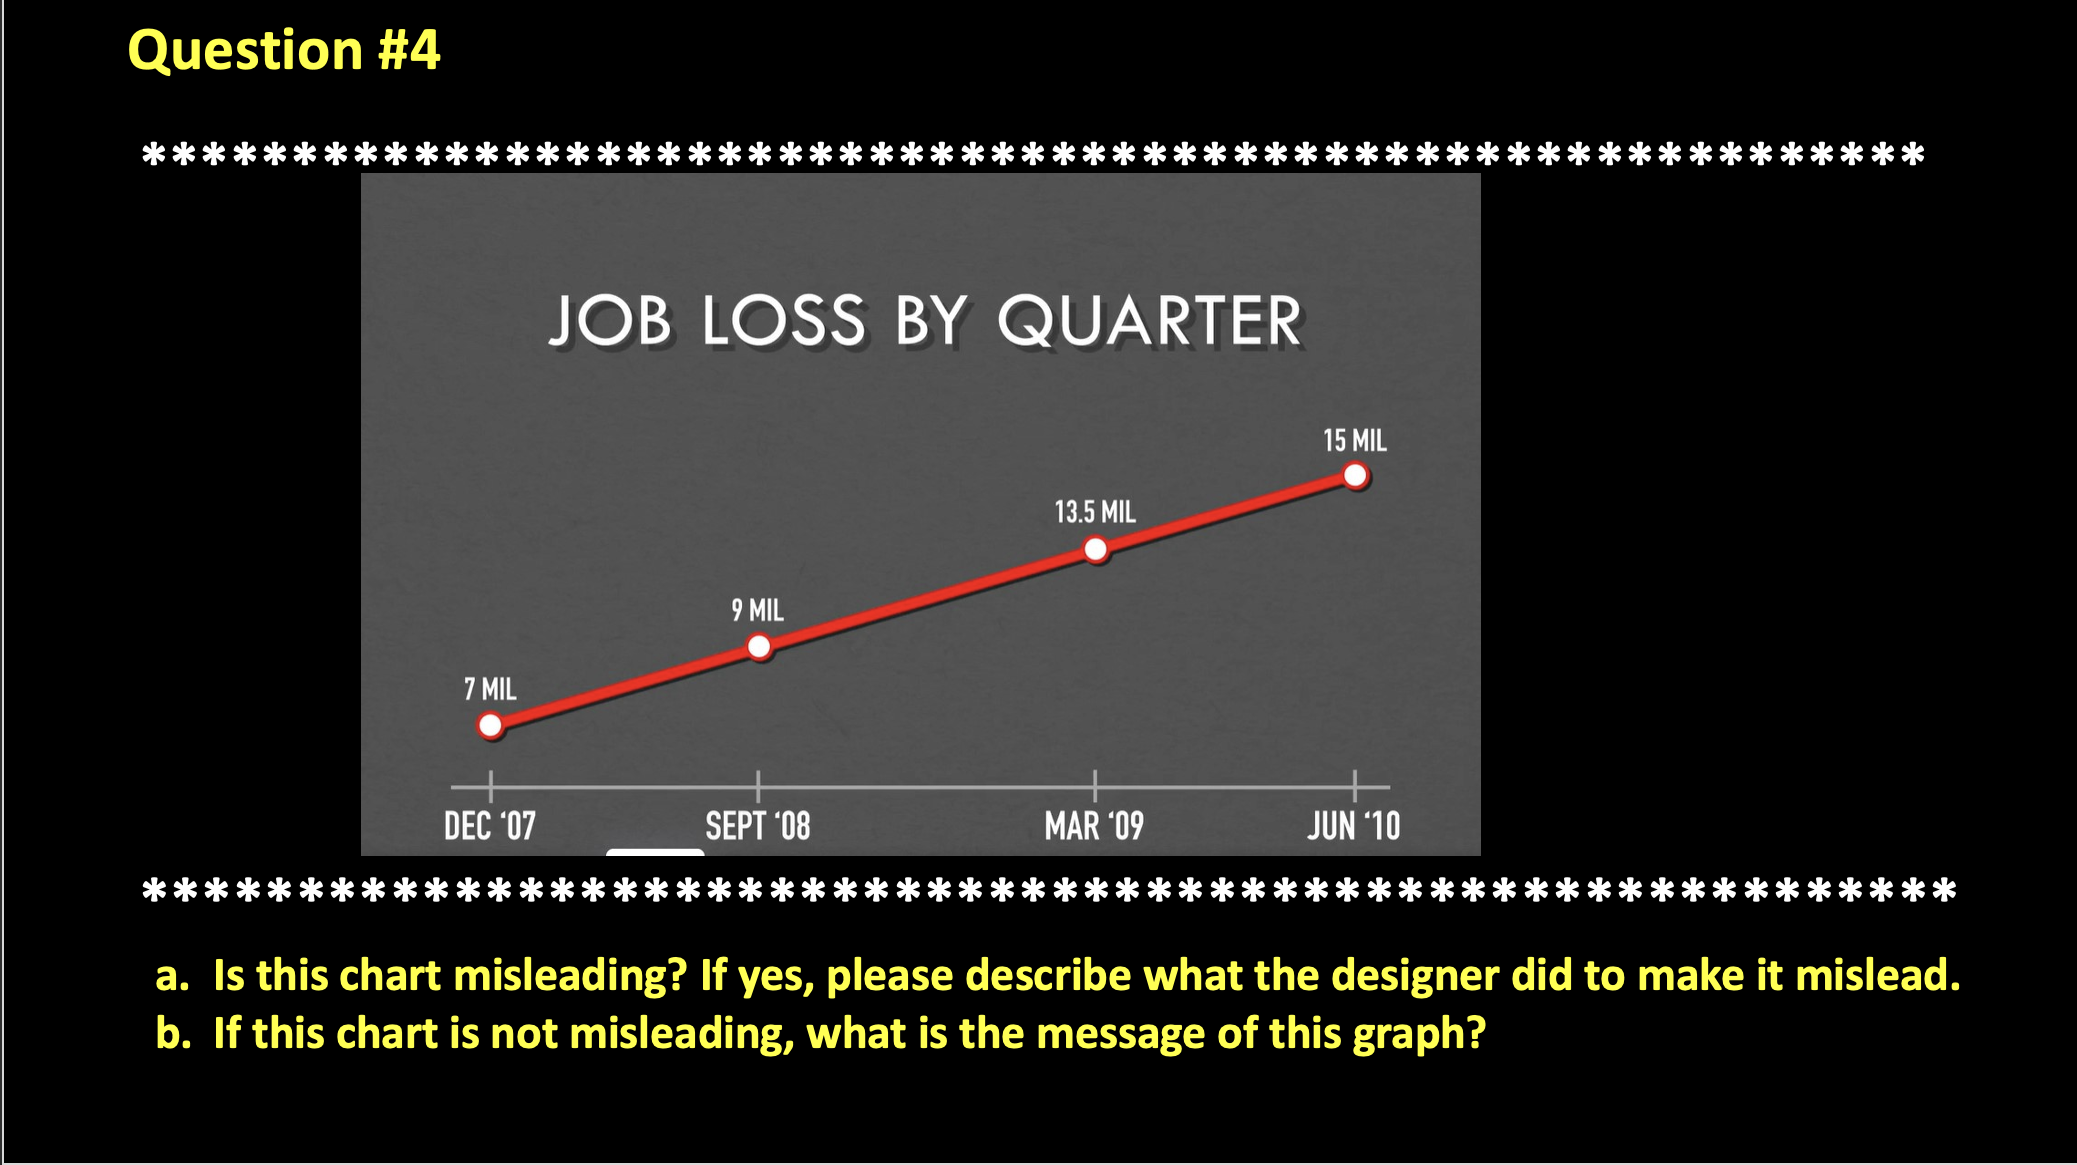
Question #4 7 MIL DEC '07 ***** JOB LOSS BY QUARTER 9 MIL SEPT '08 ******: **** 13.5 MIL MAR '09 15 MIL + JUN '10 ****: **** a. Is this chart misleading? If yes, please describe what the designer did to make it mislead. b. If this chart is not misleading, what is the message of this graph?
Step by Step Solution
★★★★★
3.53 Rating (163 Votes )
There are 3 Steps involved in it
1 Expert Approved Answer
Step: 1 Unlock

a Yes this chart appears to be misleading for a couple of reasons 1 The yaxis vertical axis does not ... View full answer
Question Has Been Solved by an Expert!
Get step-by-step solutions from verified subject matter experts
Step: 2 Unlock
Step: 3 Unlock