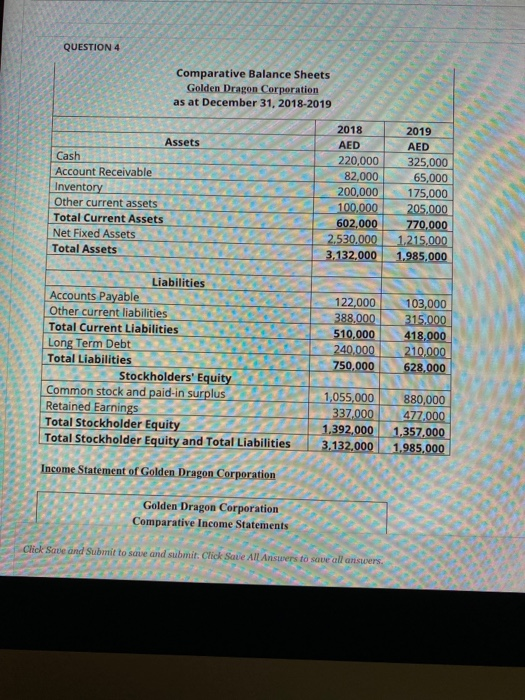
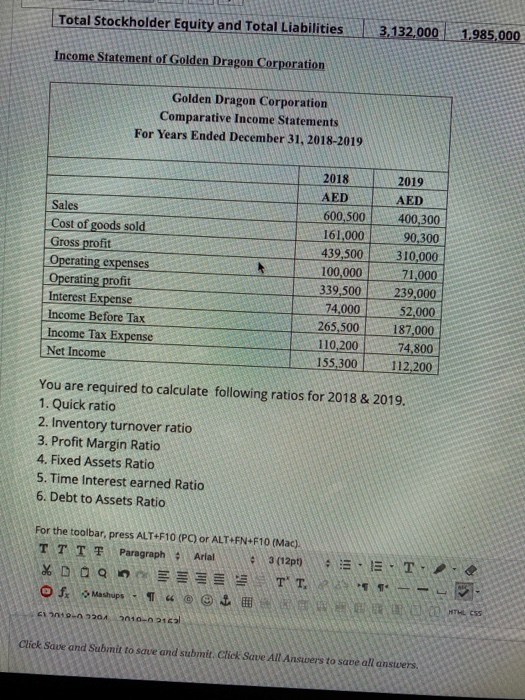
QUESTION 4 Comparative Balance Sheets Golden Dragon Corporation as at December 31, 2018-2019 Assets Cash Account Receivable Inventory Other current assets Total Current Assets Net Fixed Assets Total Assets 2018 AED 220,000 82,000 200,000 100.000 602,000 2,530,000 3,132,000 2019 AED 325,000 65,000 175,000 205,000 770,000 1,215,000 1,985,000 122,000 388,000 510,000 240.000 750,000 103,000 315.000 418,000 210,000 628,000 Liabilities Accounts Payable Other current liabilities Total Current Liabilities Long Term Debt Total Liabilities Stockholders' Equity Common stock and paid-in surplus Retained Earnings Total Stockholder Equity Total Stockholder Equity and Total Liabilities Income Statement of Golden Dragon Corporation 1,055,000 337,000 1,392,000 3,132,000 880,000 477,000 1,357.000 1.985,000 Golden Dragon Corporation Comparative Income Statements Click Save and Submit to save and submit. Click Save All Answers to save all answers Total Stockholder Equity and Total Liabilities 3,132,000 1,985,000 Income Statement of Golden Dragon Corporation Golden Dragon Corporation Comparative Income Statements For Years Ended December 31, 2018-2019 Sales Cost of goods sold Gross profit Operating expenses Operating profit Interest Expense Income Before Tax Income Tax Expense Net Income 2018 AED 600,500 161,000 439,500 100,000 339,500 74,000 265,500 110,200 155,300 2019 AED 400,300 90,300 310,000 71,000 239,000 52,000 187,000 74,800 112,200 You are required to calculate following ratios for 2018 & 2019. 1. Quick ratio 2. Inventory turnover ratio 3. Profit Margin Ratio 4. Fixed Assets Ratio 5. Time Interest earned Ratio 6. Debt to Assets Ratio For the toolbar, press ALT+F10 (PC) or ALT+FN+F10 (Mac). Paragraph Arial 3 (12pt) %D09 TT. O fx Mashups - 14 @ @ 43. ET 2010-621cal Click Save and Submit to save and submit. Click Save All Ansers to save all anstvers