Question:
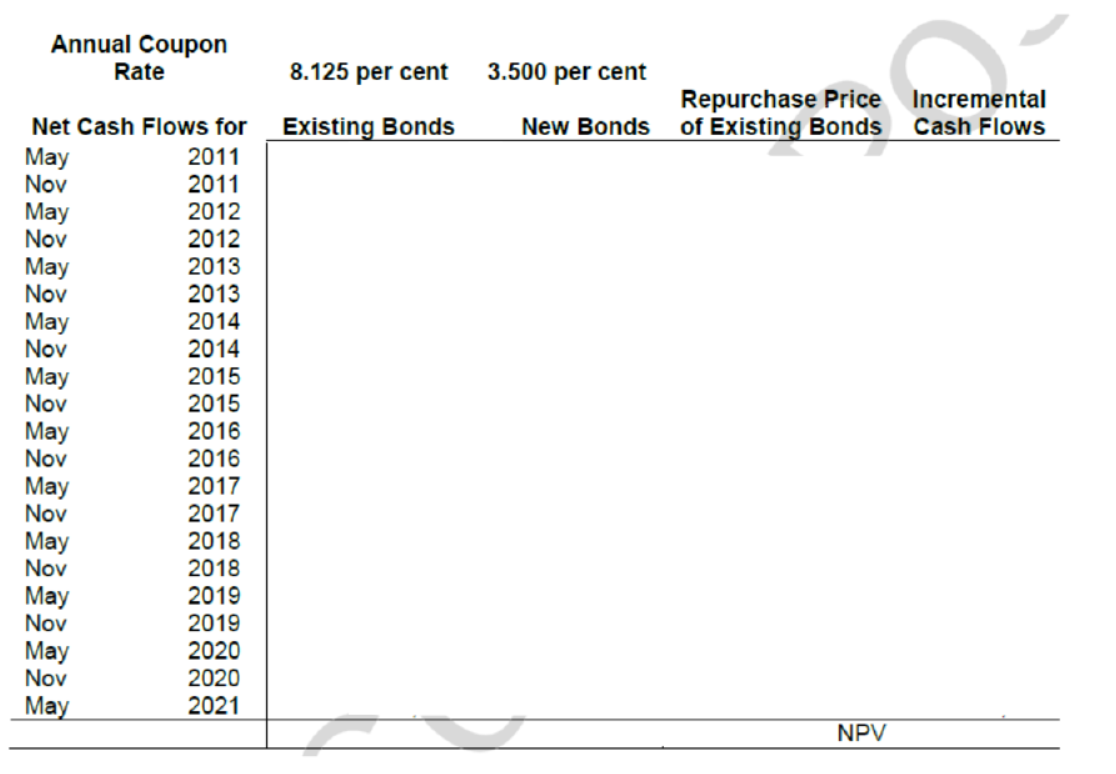
- What are the incremental cash flows of the new bond compared to the one that was replaced? (Assume that the par value of the new bond is 333,333GBP.) (5)
- Show the cash flows in a spreadsheet with the following columns (4):
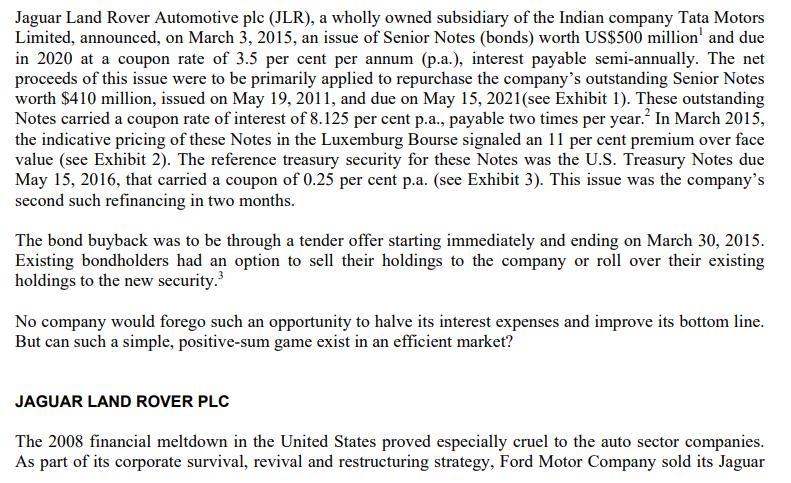
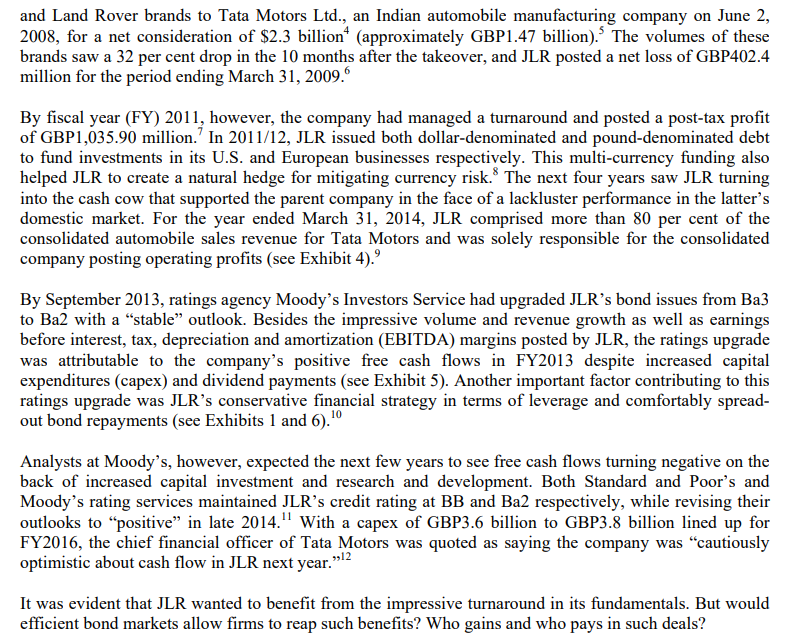
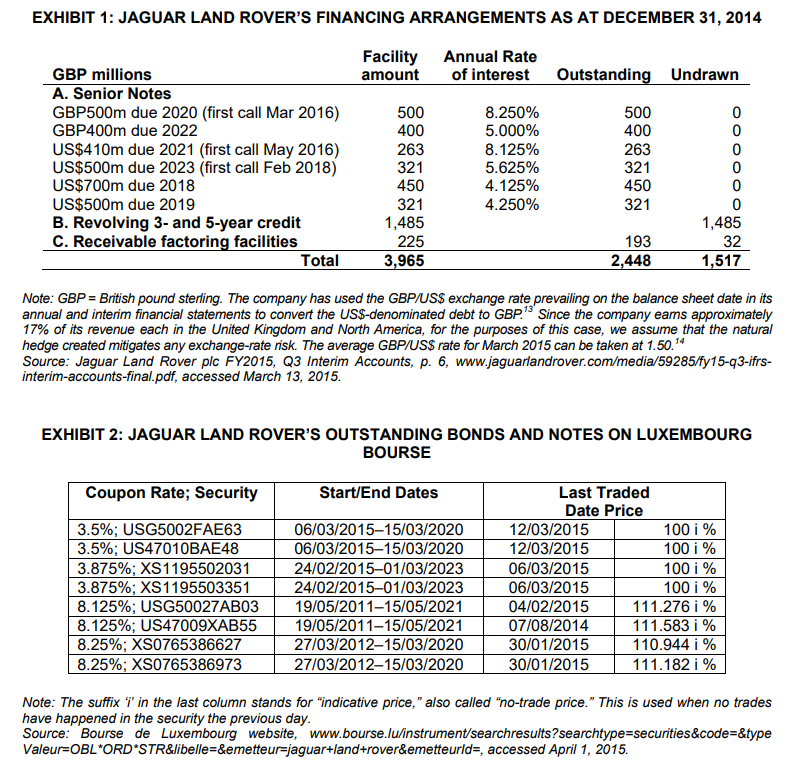
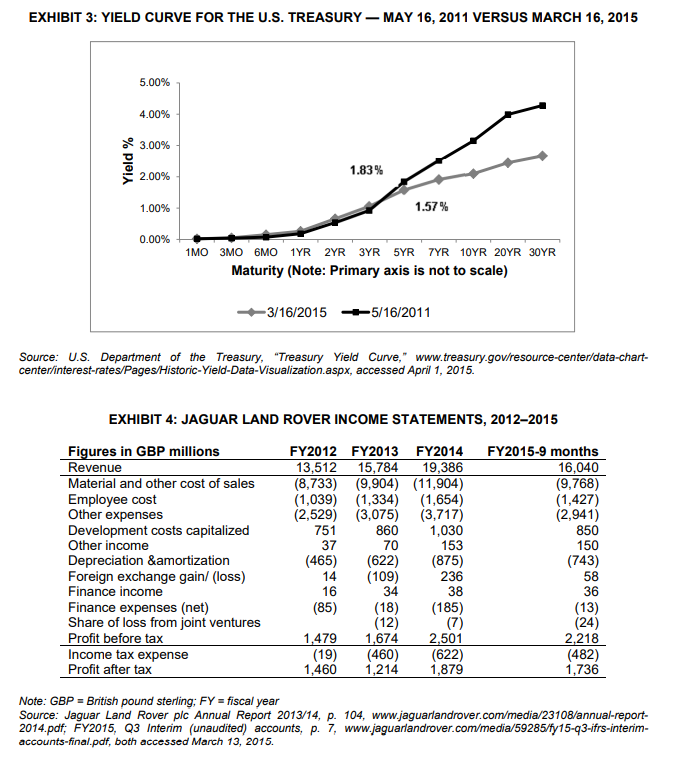
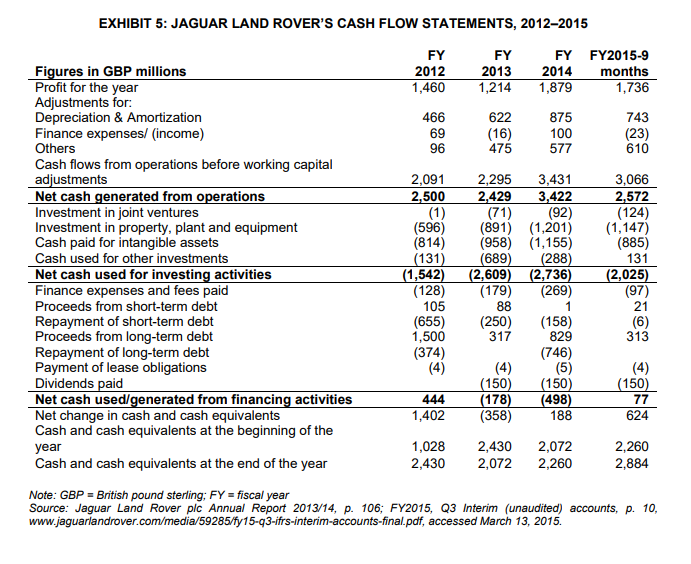
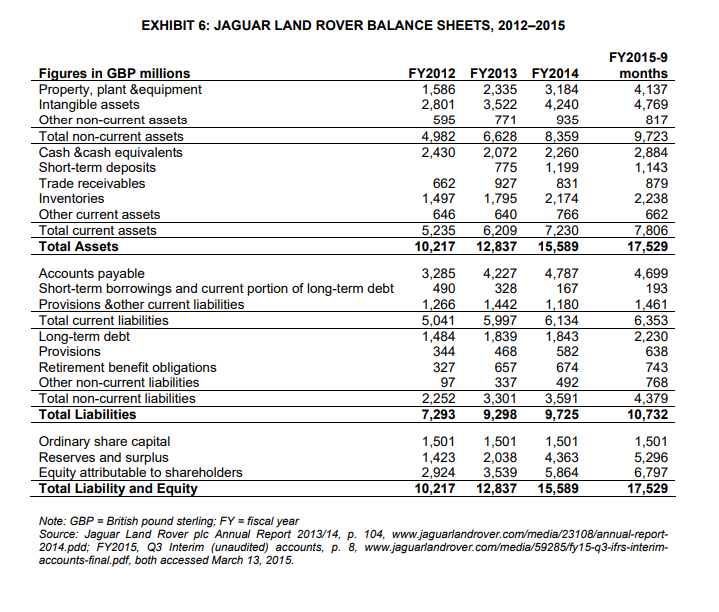
Jaguar Land Rover Automotive plc (JLR), a wholly owned subsidiary of the Indian company Tata Motors Limited, announced, on March 3, 2015, an issue of Senior Notes (bonds) worth US$500 million' and due in 2020 at a coupon rate of 3.5 per cent per annum (p.a.), interest payable semi-annually. The net proceeds of this issue were to be primarily applied to repurchase the company's outstanding Senior Notes worth $410 million, issued on May 19, 2011, and due on May 15, 2021(see Exhibit 1). These outstanding Notes carried a coupon rate of interest of 8.125 per cent p.a., payable two times per year. In March 2015, the indicative pricing of these Notes in the Luxemburg Bourse signaled an 11 per cent premium over face value (see Exhibit 2). The reference treasury security for these Notes was the U.S. Treasury Notes due May 15, 2016, that carried a coupon of 0.25 per cent p.a. (see Exhibit 3). This issue was the company's second such refinancing in two months. The bond buyback was to be through a tender offer starting immediately and ending on March 30, 2015. Existing bondholders had an option to sell their holdings to the company or roll over their existing holdings to the new security. No company would forego such an opportunity to halve its interest expenses and improve its bottom line. But can such a simple, positive-sum game exist in an efficient market? JAGUAR LAND ROVER PLC The 2008 financial meltdown in the United States proved especially cruel to the auto sector companies. As part of its corporate survival, revival and restructuring strategy, Ford Motor Company sold its Jaguar and Land Rover brands to Tata Motors Ltd., an Indian automobile manufacturing company on June 2, 2008, for a net consideration of $2.3 billion (approximately GBP1.47 billion). The volumes of these brands saw a 32 per cent drop in the 10 months after the takeover, and JLR posted a net loss of GBP402.4 million for the period ending March 31, 2009. By fiscal year (FY) 2011, however, the company had managed a turnaround and posted a post-tax profit of GBP1,035.90 million.' In 2011/12, JLR issued both dollar-denominated and pound-denominated debt to fund investments in its U.S. and European businesses respectively. This multi-currency funding also helped JLR to create a natural hedge for mitigating currency risk. The next four years saw JLR turning into the cash cow that supported the parent company in the face of a lackluster performance in the latter's domestic market. For the year ended March 31, 2014, JLR comprised more than 80 per cent of the consolidated automobile sales revenue for Tata Motors and was solely responsible for the consolidated company posting operating profits (see Exhibit 4). By September 2013, ratings agency Moody's Investors Service had upgraded JLRs bond issues from Ba3 to Ba2 with a stable outlook. Besides the impressive volume and revenue growth as well as earnings before interest, tax, depreciation and amortization (EBITDA) margins posted by JLR, the ratings upgrade was attributable to the company's positive free cash flows in FY2013 despite increased capital expenditures (capex) and dividend payments (see Exhibit 5). Another important factor contributing to this ratings upgrade was JLR's conservative financial strategy in terms of leverage and comfortably spread- out bond repayments (see Exhibits 1 and 6).'' Analysts at Moody's, however, expected the next few years to see free cash flows turning negative on the back of increased capital investment and research and development. Both Standard and Poor's and Moody's rating services maintained JLR's credit rating at BB and Ba2 respectively, while revising their outlooks to positive in late 2014." With a capex of GBP3.6 billion to GBP3.8 billion lined up for FY2016, the chief financial officer of Tata Motors was quoted as saying the company was cautiously optimistic about cash flow in JLR next year.! 2 It was evident that JLR wanted to benefit from the impressive turnaround in its fundamentals. But would efficient bond markets allow firms to reap such benefits? Who gains and who pays in such deals? EXHIBIT 1: JAGUAR LAND ROVER'S FINANCING ARRANGEMENTS AS AT DECEMBER 31, 2014 Facility amount Annual Rate of interest Outstanding Undrawn GBP millions A. Senior Notes GBP500m due 2020 (first call Mar 2016) GBP400m due 2022 US$410m due 2021 (first call May 2016) US$500m due 2023 (first call Feb 2018) US$700m due 2018 US$500m due 2019 B. Revolving 3- and 5-year credit C. Receivable factoring facilities Total 500 400 263 321 450 321 1,485 225 3,965 8.250% 5.000% 8.125% 5.625% 4.125% 4.250% 500 400 263 321 450 321 OOOOO 0 1,485 32 1,517 193 2,448 Note: GBP = British pound sterling. The company has used the GBP/US$ exchange rate prevailing on the balance sheet date in its annual and interim financial statements to convert the USS-denominated debt to GBP.13 Since the company ears approximately 17% of its revenue each in the United Kingdom and North America, for the purposes of this case, we assume that the natural hedge created mitigates any exchange-rate risk. The average GBP/US$ rate for March 2015 can be taken at 1.50.** Source: Jaguar Land Rover plc FY2015, Q3 Interim Accounts, p. 6, www.jaguarlandrover.com/media/59285/fy15-93-ifrs- interim-accounts-final.pdf, accessed March 13, 2015. EXHIBIT 2: JAGUAR LAND ROVER'S OUTSTANDING BONDS AND NOTES ON LUXEMBOURG BOURSE Coupon Rate; Security Start/End Dates 3.5%; USG5002FAE63 3.5%; US47010BAE48 3.875%; XS1195502031 3.875%; XS1195503351 8.125%; USG50027AB03 8.125%; US47009XAB55 8.25%; XS0765386627 8.25%; XS0765386973 06/03/201515/03/2020 06/03/201515/03/2020 24/02/2015-01/03/2023 24/02/2015-01/03/2023 19/05/2011-15/05/2021 19/05/2011-15/05/2021 27/03/2012-15/03/2020 27/03/201215/03/2020 Last Traded Date Price 12/03/2015 100 i % 12/03/2015 100 i % 06/03/2015 100 i % 06/03/2015 100 i % 04/02/2015 111.276 i % 07/08/2014 111.583 i % 30/01/2015 110.944 i % 30/01/2015 111.182 i % Note: The suffix l' in the last column stands for "indicative price," also called "no-trade price." This is used when no trades have happened in the security the previous day. Source: Bourse de Luxembourg website, www.bourse.lu/instrument/searchresults?searchtype=securities&code=&type Valeur=OBL*ORD STR&libelle=&emetteur-jaguar+land+rover&emetteurlds, accessed April 1, 2015. EXHIBIT 3: YIELD CURVE FOR THE U.S. TREASURY - MAY 16, 2011 VERSUS MARCH 16, 2015 5.00% 4.00% 3.00% Yield % 2.00% 1.83% 1.00% 1.57% 0.00% 1 6 1YR 2YR 3YR SYR TYR 10YR 20YR 30YR Maturity (Note: Primary axis is not to scale) 3/16/2015 -5/16/2011 Source: U.S. Department of the Treasury, "Treasury Yield Curve," www.treasury.gov/resource-center/data-chart- center/interest-rates/Pages/Historic-Yield-Data-Visualization.aspx, accessed April 1, 2015. EXHIBIT 4: JAGUAR LAND ROVER INCOME STATEMENTS, 2012-2015 Figures in GBP millions Revenue Material and other cost of sales Employee cost Other expenses Development costs capitalized Other income Depreciation &amortization Foreign exchange gain/ (loss) Finance income Finance expenses (net) Share of loss from joint ventures Profit before tax Income tax expense Profit after tax FY2012 FY2013 FY2014 13,512 15,784 19,386 (8,733) (9,904) (11,904) (1,039) (1,334) (1,654) (2,529) (3,075) (3,717) 751 860 1,030 37 70 153 (465) (622) (875) 14 (109) 236 16 34 38 (85) (18) (185) (12) (7) 1,479 1,674 2,501 (19) (460) (622) 1,460 1,214 1,879 FY2015-9 months 16,040 (9,768) (1,427) (2,941) 850 150 (743) 58 36 (13) (24) 2.218 (482) 1,736 Note: GBP - British pound sterling; FY = fiscal year Source: Jaguar Land Rover pic Annual Report 2013/14, p. 104, www.jaguarlandrover.com/media/23108/annual-report- 2014.pdf, FY2015, Q3 Interim (unaudited) accounts, p. 7, www.jaguarlandrover.com/media/59285/fy15-93-ifrs-interim- accounts-final.pdf, both accessed March 13, 2015. 96 EXHIBIT 5: JAGUAR LAND ROVER'S CASH FLOW STATEMENTS, 2012-2015 FY FY FY FY2015-9 Figures in GBP millions 2012 2013 2014 months Profit for the year 1,460 1,214 1,879 1,736 Adjustments for: Depreciation & Amortization 466 622 875 743 Finance expenses/ (income) 69 (16) 100 (23) Others 475 577 610 Cash flows from operations before working capital adjustments 2,091 2,295 3,431 3,066 Net cash generated from operations 2,500 2,429 3,422 2,572 Investment in joint ventures (1) (71) (92) (124) Investment in property, plant and equipment (596) (891) (1,201) (1,147) Cash paid for intangible assets (814) (958) (1,155) (885) Cash used for other investments (131) (689) (288) 131 Net cash used for investing activities (1,542) (2,609) (2,736) (2,025) Finance expenses and fees paid (128) (179) (269) (97) Proceeds from short-term debt 105 88 Repayment of short-term debt (655) (250) (158) (6) Proceeds from long-term debt 1,500 317 829 313 Repayment of long-term debt (374) (746) Payment of lease obligations (4) (4) (5) (4) Dividends paid (150) (150) (150) Net cash used/generated from financing activities 444 (178) (498) 77 Net change in cash and cash equivalents 1,402 (358) 188 624 Cash and cash equivalents at the beginning of the year 1,028 2,430 2,072 2,260 Cash and cash equivalents at the end of the year 2,430 2,072 2,260 2,884 Note: GBP - British pound sterling; FY = fiscal year Source: Jaguar Land Rover pic Annual Report 2013/14, p. 106; FY2015, Q3 Interim (unaudited) accounts, p. 10, www.jaguarlandrover.com/media/59285/fy15-93-ifrs-interim-accounts-final.pdf, accessed March 13, 2015. 21 EXHIBIT 6: JAGUAR LAND ROVER BALANCE SHEETS, 2012-2015 FY2012 FY2013 FY2014 1,586 2,335 3,184 2,801 3,522 4,240 595 771 935 4,982 6,628 8,359 2,430 2,072 2,260 775 1,199 662 927 831 1,497 1,795 2,174 646 640 766 5,235 6,209 7,230 10,217 12,837 15,589 Figures in GBP millions Property, plant & equipment Intangible assets Other non-current assets Total non-current assets Cash &cash equivalents Short-term deposits Trade receivables Inventories Other current assets Total current assets Total Assets Accounts payable Short-term borrowings and current portion of long-term debt Provisions &other current liabilities Total current liabilities Long-term debt Provisions Retirement benefit obligations Other non-current liabilities Total non-current liabilities Total Liabilities Ordinary share capital Reserves and surplus Equity attributable to shareholders Total Liability and Equity FY2015-9 months 4,137 4,769 817 9,723 2,884 1,143 879 2,238 662 7,806 17,529 4,699 193 1,461 6,353 2,230 638 743 768 4,379 10,732 3,285 490 1,266 5,041 1,484 344 327 97 2,252 7,293 4,227 328 1,442 5,997 1,839 468 657 337 3,301 9,298 4,787 167 1,180 6,134 1,843 582 674 492 3,591 9,725 1,501 1,423 2,924 10,217 1,501 2,038 3,539 12,837 1,501 4,363 5,864 15,589 1,501 5,296 6,797 17,529 Note: GBP - British pound sterling; FY = fiscal year Source: Jaguar Land Rover plc Annual Report 2013/14, p. 104, www.jaguarlandrover.com/media/23108/annual-report- 2014.pdd; FY2015, Q3 Interim (unaudited) accounts, p. 8, www.jaguarlandrover.com/media/59285/fy15-93-ifrs-interim- accounts-final.pdf, both accessed March 13, 2015. Annual Coupon Rate 8.125 per cent 3.500 per cent Repurchase Price New Bonds of Existing Bonds Incremental Cash Flows Existing Bonds Nov Net Cash Flows for May 2011 2011 May 2012 Nov 2012 May 2013 Nov 2013 May 2014 Nov 2014 May 2015 Nov 2015 May 2016 Nov 2016 May 2017 Nov 2017 May 2018 Nov 2018 2019 2019 May 2020 Nov 2020 May 2021 May Nov NPV Jaguar Land Rover Automotive plc (JLR), a wholly owned subsidiary of the Indian company Tata Motors Limited, announced, on March 3, 2015, an issue of Senior Notes (bonds) worth US$500 million' and due in 2020 at a coupon rate of 3.5 per cent per annum (p.a.), interest payable semi-annually. The net proceeds of this issue were to be primarily applied to repurchase the company's outstanding Senior Notes worth $410 million, issued on May 19, 2011, and due on May 15, 2021(see Exhibit 1). These outstanding Notes carried a coupon rate of interest of 8.125 per cent p.a., payable two times per year. In March 2015, the indicative pricing of these Notes in the Luxemburg Bourse signaled an 11 per cent premium over face value (see Exhibit 2). The reference treasury security for these Notes was the U.S. Treasury Notes due May 15, 2016, that carried a coupon of 0.25 per cent p.a. (see Exhibit 3). This issue was the company's second such refinancing in two months. The bond buyback was to be through a tender offer starting immediately and ending on March 30, 2015. Existing bondholders had an option to sell their holdings to the company or roll over their existing holdings to the new security. No company would forego such an opportunity to halve its interest expenses and improve its bottom line. But can such a simple, positive-sum game exist in an efficient market? JAGUAR LAND ROVER PLC The 2008 financial meltdown in the United States proved especially cruel to the auto sector companies. As part of its corporate survival, revival and restructuring strategy, Ford Motor Company sold its Jaguar and Land Rover brands to Tata Motors Ltd., an Indian automobile manufacturing company on June 2, 2008, for a net consideration of $2.3 billion (approximately GBP1.47 billion). The volumes of these brands saw a 32 per cent drop in the 10 months after the takeover, and JLR posted a net loss of GBP402.4 million for the period ending March 31, 2009. By fiscal year (FY) 2011, however, the company had managed a turnaround and posted a post-tax profit of GBP1,035.90 million.' In 2011/12, JLR issued both dollar-denominated and pound-denominated debt to fund investments in its U.S. and European businesses respectively. This multi-currency funding also helped JLR to create a natural hedge for mitigating currency risk. The next four years saw JLR turning into the cash cow that supported the parent company in the face of a lackluster performance in the latter's domestic market. For the year ended March 31, 2014, JLR comprised more than 80 per cent of the consolidated automobile sales revenue for Tata Motors and was solely responsible for the consolidated company posting operating profits (see Exhibit 4). By September 2013, ratings agency Moody's Investors Service had upgraded JLRs bond issues from Ba3 to Ba2 with a stable outlook. Besides the impressive volume and revenue growth as well as earnings before interest, tax, depreciation and amortization (EBITDA) margins posted by JLR, the ratings upgrade was attributable to the company's positive free cash flows in FY2013 despite increased capital expenditures (capex) and dividend payments (see Exhibit 5). Another important factor contributing to this ratings upgrade was JLR's conservative financial strategy in terms of leverage and comfortably spread- out bond repayments (see Exhibits 1 and 6).'' Analysts at Moody's, however, expected the next few years to see free cash flows turning negative on the back of increased capital investment and research and development. Both Standard and Poor's and Moody's rating services maintained JLR's credit rating at BB and Ba2 respectively, while revising their outlooks to positive in late 2014." With a capex of GBP3.6 billion to GBP3.8 billion lined up for FY2016, the chief financial officer of Tata Motors was quoted as saying the company was cautiously optimistic about cash flow in JLR next year.! 2 It was evident that JLR wanted to benefit from the impressive turnaround in its fundamentals. But would efficient bond markets allow firms to reap such benefits? Who gains and who pays in such deals? EXHIBIT 1: JAGUAR LAND ROVER'S FINANCING ARRANGEMENTS AS AT DECEMBER 31, 2014 Facility amount Annual Rate of interest Outstanding Undrawn GBP millions A. Senior Notes GBP500m due 2020 (first call Mar 2016) GBP400m due 2022 US$410m due 2021 (first call May 2016) US$500m due 2023 (first call Feb 2018) US$700m due 2018 US$500m due 2019 B. Revolving 3- and 5-year credit C. Receivable factoring facilities Total 500 400 263 321 450 321 1,485 225 3,965 8.250% 5.000% 8.125% 5.625% 4.125% 4.250% 500 400 263 321 450 321 OOOOO 0 1,485 32 1,517 193 2,448 Note: GBP = British pound sterling. The company has used the GBP/US$ exchange rate prevailing on the balance sheet date in its annual and interim financial statements to convert the USS-denominated debt to GBP.13 Since the company ears approximately 17% of its revenue each in the United Kingdom and North America, for the purposes of this case, we assume that the natural hedge created mitigates any exchange-rate risk. The average GBP/US$ rate for March 2015 can be taken at 1.50.** Source: Jaguar Land Rover plc FY2015, Q3 Interim Accounts, p. 6, www.jaguarlandrover.com/media/59285/fy15-93-ifrs- interim-accounts-final.pdf, accessed March 13, 2015. EXHIBIT 2: JAGUAR LAND ROVER'S OUTSTANDING BONDS AND NOTES ON LUXEMBOURG BOURSE Coupon Rate; Security Start/End Dates 3.5%; USG5002FAE63 3.5%; US47010BAE48 3.875%; XS1195502031 3.875%; XS1195503351 8.125%; USG50027AB03 8.125%; US47009XAB55 8.25%; XS0765386627 8.25%; XS0765386973 06/03/201515/03/2020 06/03/201515/03/2020 24/02/2015-01/03/2023 24/02/2015-01/03/2023 19/05/2011-15/05/2021 19/05/2011-15/05/2021 27/03/2012-15/03/2020 27/03/201215/03/2020 Last Traded Date Price 12/03/2015 100 i % 12/03/2015 100 i % 06/03/2015 100 i % 06/03/2015 100 i % 04/02/2015 111.276 i % 07/08/2014 111.583 i % 30/01/2015 110.944 i % 30/01/2015 111.182 i % Note: The suffix l' in the last column stands for "indicative price," also called "no-trade price." This is used when no trades have happened in the security the previous day. Source: Bourse de Luxembourg website, www.bourse.lu/instrument/searchresults?searchtype=securities&code=&type Valeur=OBL*ORD STR&libelle=&emetteur-jaguar+land+rover&emetteurlds, accessed April 1, 2015. EXHIBIT 3: YIELD CURVE FOR THE U.S. TREASURY - MAY 16, 2011 VERSUS MARCH 16, 2015 5.00% 4.00% 3.00% Yield % 2.00% 1.83% 1.00% 1.57% 0.00% 1 6 1YR 2YR 3YR SYR TYR 10YR 20YR 30YR Maturity (Note: Primary axis is not to scale) 3/16/2015 -5/16/2011 Source: U.S. Department of the Treasury, "Treasury Yield Curve," www.treasury.gov/resource-center/data-chart- center/interest-rates/Pages/Historic-Yield-Data-Visualization.aspx, accessed April 1, 2015. EXHIBIT 4: JAGUAR LAND ROVER INCOME STATEMENTS, 2012-2015 Figures in GBP millions Revenue Material and other cost of sales Employee cost Other expenses Development costs capitalized Other income Depreciation &amortization Foreign exchange gain/ (loss) Finance income Finance expenses (net) Share of loss from joint ventures Profit before tax Income tax expense Profit after tax FY2012 FY2013 FY2014 13,512 15,784 19,386 (8,733) (9,904) (11,904) (1,039) (1,334) (1,654) (2,529) (3,075) (3,717) 751 860 1,030 37 70 153 (465) (622) (875) 14 (109) 236 16 34 38 (85) (18) (185) (12) (7) 1,479 1,674 2,501 (19) (460) (622) 1,460 1,214 1,879 FY2015-9 months 16,040 (9,768) (1,427) (2,941) 850 150 (743) 58 36 (13) (24) 2.218 (482) 1,736 Note: GBP - British pound sterling; FY = fiscal year Source: Jaguar Land Rover pic Annual Report 2013/14, p. 104, www.jaguarlandrover.com/media/23108/annual-report- 2014.pdf, FY2015, Q3 Interim (unaudited) accounts, p. 7, www.jaguarlandrover.com/media/59285/fy15-93-ifrs-interim- accounts-final.pdf, both accessed March 13, 2015. 96 EXHIBIT 5: JAGUAR LAND ROVER'S CASH FLOW STATEMENTS, 2012-2015 FY FY FY FY2015-9 Figures in GBP millions 2012 2013 2014 months Profit for the year 1,460 1,214 1,879 1,736 Adjustments for: Depreciation & Amortization 466 622 875 743 Finance expenses/ (income) 69 (16) 100 (23) Others 475 577 610 Cash flows from operations before working capital adjustments 2,091 2,295 3,431 3,066 Net cash generated from operations 2,500 2,429 3,422 2,572 Investment in joint ventures (1) (71) (92) (124) Investment in property, plant and equipment (596) (891) (1,201) (1,147) Cash paid for intangible assets (814) (958) (1,155) (885) Cash used for other investments (131) (689) (288) 131 Net cash used for investing activities (1,542) (2,609) (2,736) (2,025) Finance expenses and fees paid (128) (179) (269) (97) Proceeds from short-term debt 105 88 Repayment of short-term debt (655) (250) (158) (6) Proceeds from long-term debt 1,500 317 829 313 Repayment of long-term debt (374) (746) Payment of lease obligations (4) (4) (5) (4) Dividends paid (150) (150) (150) Net cash used/generated from financing activities 444 (178) (498) 77 Net change in cash and cash equivalents 1,402 (358) 188 624 Cash and cash equivalents at the beginning of the year 1,028 2,430 2,072 2,260 Cash and cash equivalents at the end of the year 2,430 2,072 2,260 2,884 Note: GBP - British pound sterling; FY = fiscal year Source: Jaguar Land Rover pic Annual Report 2013/14, p. 106; FY2015, Q3 Interim (unaudited) accounts, p. 10, www.jaguarlandrover.com/media/59285/fy15-93-ifrs-interim-accounts-final.pdf, accessed March 13, 2015. 21 EXHIBIT 6: JAGUAR LAND ROVER BALANCE SHEETS, 2012-2015 FY2012 FY2013 FY2014 1,586 2,335 3,184 2,801 3,522 4,240 595 771 935 4,982 6,628 8,359 2,430 2,072 2,260 775 1,199 662 927 831 1,497 1,795 2,174 646 640 766 5,235 6,209 7,230 10,217 12,837 15,589 Figures in GBP millions Property, plant & equipment Intangible assets Other non-current assets Total non-current assets Cash &cash equivalents Short-term deposits Trade receivables Inventories Other current assets Total current assets Total Assets Accounts payable Short-term borrowings and current portion of long-term debt Provisions &other current liabilities Total current liabilities Long-term debt Provisions Retirement benefit obligations Other non-current liabilities Total non-current liabilities Total Liabilities Ordinary share capital Reserves and surplus Equity attributable to shareholders Total Liability and Equity FY2015-9 months 4,137 4,769 817 9,723 2,884 1,143 879 2,238 662 7,806 17,529 4,699 193 1,461 6,353 2,230 638 743 768 4,379 10,732 3,285 490 1,266 5,041 1,484 344 327 97 2,252 7,293 4,227 328 1,442 5,997 1,839 468 657 337 3,301 9,298 4,787 167 1,180 6,134 1,843 582 674 492 3,591 9,725 1,501 1,423 2,924 10,217 1,501 2,038 3,539 12,837 1,501 4,363 5,864 15,589 1,501 5,296 6,797 17,529 Note: GBP - British pound sterling; FY = fiscal year Source: Jaguar Land Rover plc Annual Report 2013/14, p. 104, www.jaguarlandrover.com/media/23108/annual-report- 2014.pdd; FY2015, Q3 Interim (unaudited) accounts, p. 8, www.jaguarlandrover.com/media/59285/fy15-93-ifrs-interim- accounts-final.pdf, both accessed March 13, 2015. Annual Coupon Rate 8.125 per cent 3.500 per cent Repurchase Price New Bonds of Existing Bonds Incremental Cash Flows Existing Bonds Nov Net Cash Flows for May 2011 2011 May 2012 Nov 2012 May 2013 Nov 2013 May 2014 Nov 2014 May 2015 Nov 2015 May 2016 Nov 2016 May 2017 Nov 2017 May 2018 Nov 2018 2019 2019 May 2020 Nov 2020 May 2021 May Nov NPV