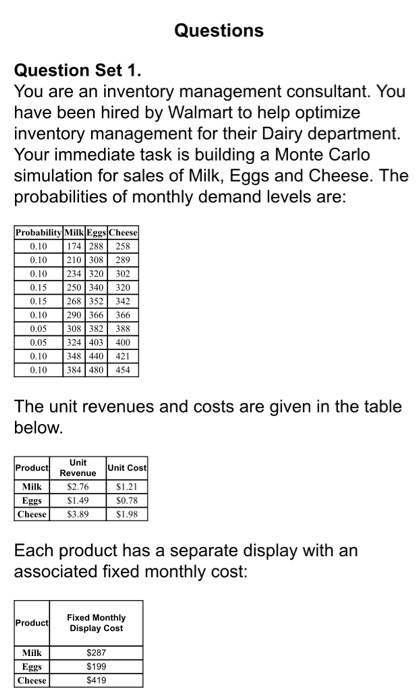
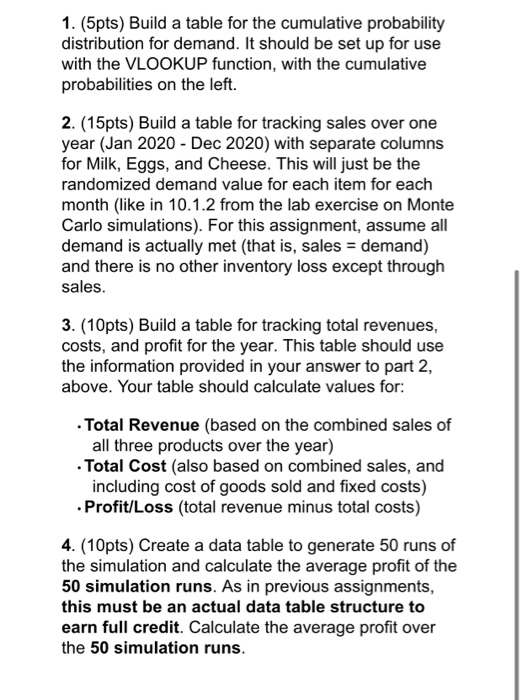
Questions Question Set 1. You are an inventory management consultant. You have been hired by Walmart to help optimize inventory management for their Dairy department. Your immediate task is building a Monte Carlo simulation for sales of Milk, Eggs and Cheese. The probabilities of monthly demand levels are: Probability Milk Eggs Cheese 0.10 174288 258 0.10 210308 289 0.10 234320 302 0.15 250 340 320 0.15 268352 342 0.10 290366 366 0.05 308382 388 0.05 324 403 400 0.10 348 | 440 421 0.10 384480 454 The unit revenues and costs are given in the table below. Product Unit Cost Milk Eggs Cheese Unit Revenue $2.76 $1.49 $3.89 $1.21 S0.78 $1.98 Each product has a separate display with an associated fixed monthly cost: Product Fixed Monthly Display Cost Milk Eggs Cheese $287 $199 $419 1. (5pts) Build a table for the cumulative probability distribution for demand. It should be set up for use with the VLOOKUP function, with the cumulative probabilities on the left. 2. (15pts) Build a table for tracking sales over one year (Jan 2020 - Dec 2020) with separate columns for Milk, Eggs, and Cheese. This will just be the randomized demand value for each item for each month (like in 10.1.2 from the lab exercise on Monte Carlo simulations). For this assignment, assume all demand is actually met (that is, sales = demand) and there is no other inventory loss except through sales. 3. (10pts) Build a table for tracking total revenues, costs, and profit for the year. This table should use the information provided in your answer to part 2, above. Your table should calculate values for: Total Revenue (based on the combined sales of all three products over the year) Total Cost (also based on combined sales, and including cost of goods sold and fixed costs) . Profit/Loss (total revenue minus total costs) 4. (10pts) Create a data table to generate 50 runs of the simulation and calculate the average profit of the 50 simulation runs. As in previous assignments, this must be an actual data table structure to earn full credit. Calculate the average profit over the 50 simulation runs. Questions Question Set 1. You are an inventory management consultant. You have been hired by Walmart to help optimize inventory management for their Dairy department. Your immediate task is building a Monte Carlo simulation for sales of Milk, Eggs and Cheese. The probabilities of monthly demand levels are: Probability Milk Eggs Cheese 0.10 174288 258 0.10 210308 289 0.10 234320 302 0.15 250 340 320 0.15 268352 342 0.10 290366 366 0.05 308382 388 0.05 324 403 400 0.10 348 | 440 421 0.10 384480 454 The unit revenues and costs are given in the table below. Product Unit Cost Milk Eggs Cheese Unit Revenue $2.76 $1.49 $3.89 $1.21 S0.78 $1.98 Each product has a separate display with an associated fixed monthly cost: Product Fixed Monthly Display Cost Milk Eggs Cheese $287 $199 $419 1. (5pts) Build a table for the cumulative probability distribution for demand. It should be set up for use with the VLOOKUP function, with the cumulative probabilities on the left. 2. (15pts) Build a table for tracking sales over one year (Jan 2020 - Dec 2020) with separate columns for Milk, Eggs, and Cheese. This will just be the randomized demand value for each item for each month (like in 10.1.2 from the lab exercise on Monte Carlo simulations). For this assignment, assume all demand is actually met (that is, sales = demand) and there is no other inventory loss except through sales. 3. (10pts) Build a table for tracking total revenues, costs, and profit for the year. This table should use the information provided in your answer to part 2, above. Your table should calculate values for: Total Revenue (based on the combined sales of all three products over the year) Total Cost (also based on combined sales, and including cost of goods sold and fixed costs) . Profit/Loss (total revenue minus total costs) 4. (10pts) Create a data table to generate 50 runs of the simulation and calculate the average profit of the 50 simulation runs. As in previous assignments, this must be an actual data table structure to earn full credit. Calculate the average profit over the 50 simulation runs