Answered step by step
Verified Expert Solution
Link Copied!

Question

1 Approved Answer

Race/Ethnicity Asian African American Hispanic White 71 years 84.5 years 75.5 years 79.5 years Mean 5.52 4.98 5.13 5.24 Standard Deviation 35 36 15 26
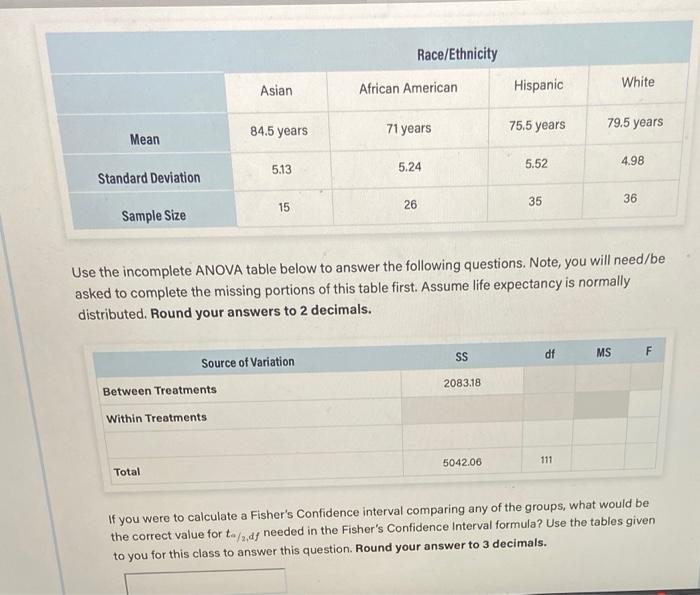
image text in transcribed
Race/Ethnicity Asian African American Hispanic White 71 years 84.5 years 75.5 years 79.5 years Mean 5.52 4.98 5.13 5.24 Standard Deviation 35 36 15 26 Sample Size Use the incomplete ANOVA table below to answer the following questions. Note, you will need/be asked to complete the missing portions of this table first. Assume life expectancy is normally distributed. Round your answers to 2 decimals. SS df MS F Source of Variation Between Treatments 2083.18 Within Treatments 5042.06 111 Total If you were to calculate a Fisher's Confidence interval comparing any of the groups, what would be the correct value for tady needed in the Fisher's Confidence interval formula? Use the tables given to you for this class to answer this question. Round your answer to 3 decimals

Step by Step Solution

There are 3 Steps involved in it

Step: 1

blur-text-image

Get Instant Access to Expert-Tailored Solutions

See step-by-step solutions with expert insights and AI powered tools for academic success

Step: 2

blur-text-image

Step: 3

blur-text-image

Ace Your Homework with AI

Get the answers you need in no time with our AI-driven, step-by-step assistance

Get Started

Recommended Textbook for

Financial And Managerial Accounting For School Administrators

Authors: Ronald E. Everett, Raymond L. Lows, Donald R. Johnson

1st Edition

157886027X, 9781578860272

More Books

Students also viewed these Accounting questions