

Answered step by step
Verified Expert Solution
Question
1 Approved Answer
ratio analiz kellogs.xlsx Current ratio Acid test ratio Cash Ratio Total asset turnover Fixed asset turnover Inventory turnover Days in Inventory A/R turnover Average collection
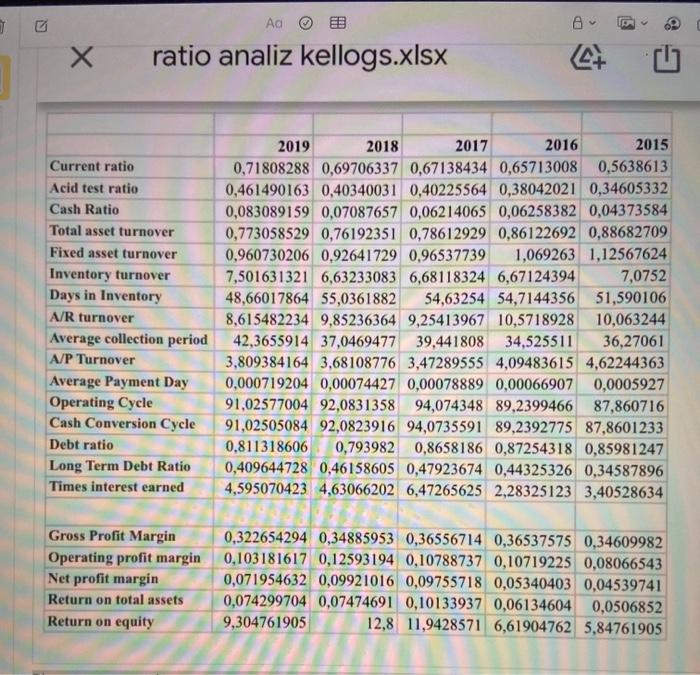

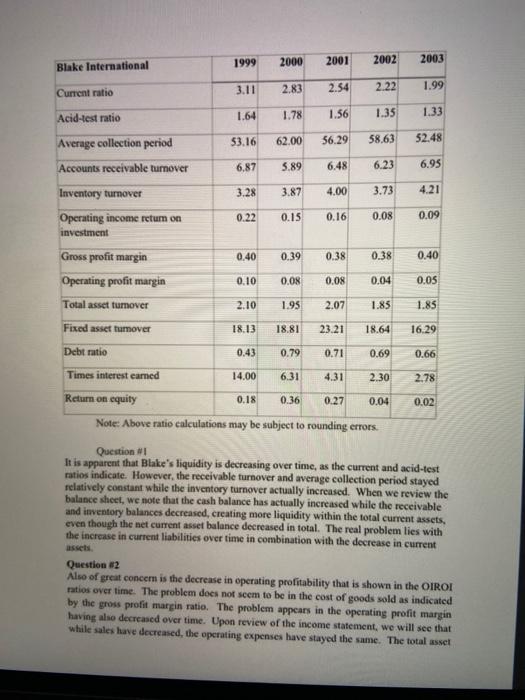
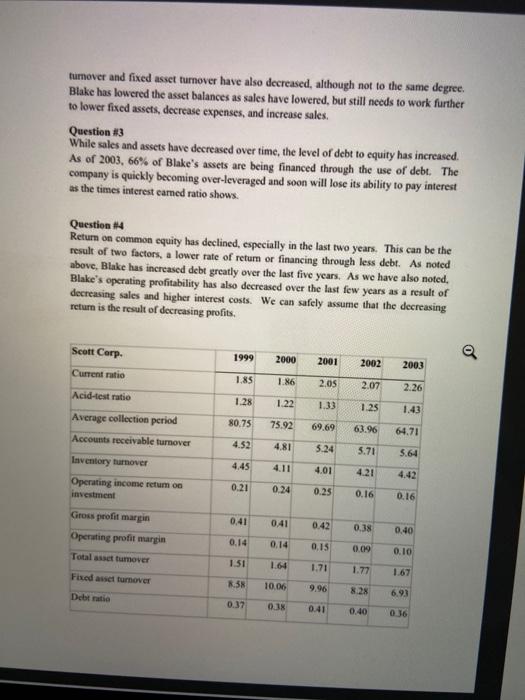
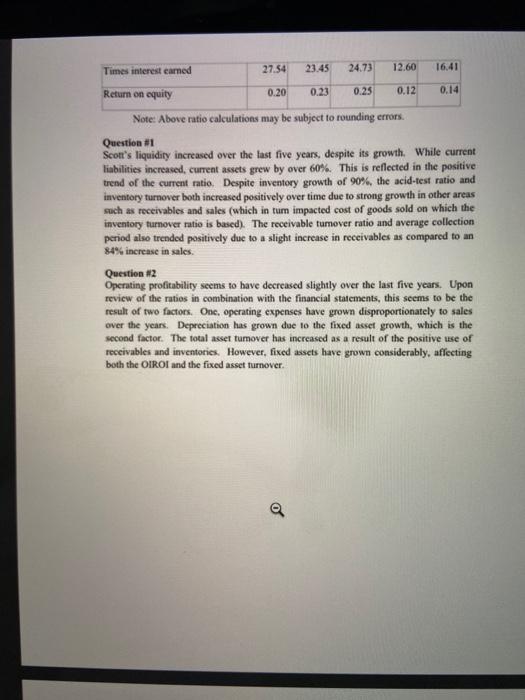
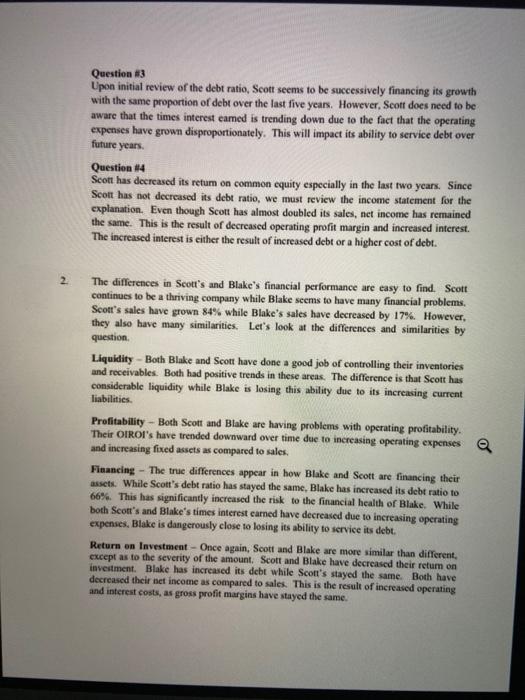 ratio analiz kellogs.xlsx Current ratio Acid test ratio Cash Ratio Total asset turnover Fixed asset turnover Inventory turnover Days in Inventory A/R turnover Average collection period A/P Turnover Average Payment Day Operating Cycle Cash Conversion Cycle Debt ratio Long Term Debt Ratio Times interest earned 2019 2018 2017 2016 2015 0,71808288 0,69706337 0,67138434 0,65713008 0.5638613 0,461490163 0,40340031 0,40225564 0,38042021 0,34605332 0,083089159 0,07087657 0,06214065 0,06258382 0,04373584 0,773058529 0,76192351 0,78612929 0,86122692 0,88682709 0,960730206 0.92641729 0,96537739 1,069263 1,12567624 7,501631321 6,63233083 6,68118324 6,67124394 7,0752 48,66017864 55,0361882 54,63254 54,7144356 51,590106 8,615482234 9,85236364 9,25413967 10,5718928 10,063244 42,3655914 37,0469477 39,441808 34,525511 36,27061 3,809384164 3,68108776 3,47289555 4,09483615 4,62244363 0,000719204 0,00074427 0,00078889 0.00066907 0,0005927 91,02577004 92,0831358 94,074348 89,2399466 87,860716 91,02505084 92,0823916 94,0735591 89,2392775 87,8601233 0.811318606 0,793982 0,8658186 0,87254318 0,85981247 0,409644728 0,46158605 0,47923674 0,44325326 0,34587896 4,595070423 4,63066202 6,47265625 2,28325123 3,40528634 Gross Profit Margin Operating profit margin Net profit margin Return on total assets Return on equity 0,322654294 0,34885953 0,36556714 0,36537575 0,34609982 0,103181617 0,12593194 0,10788737 0,10719225 0,08066543 0,071954632 0,09921016 0,09755718 0,05340403 0,04539741 0,074299704 0,07474691 0,10133937 0,06134604 0,0506852 9,304761905 12,8 11,9428571 6,61904762 5,84761905 Return on equity 9,304761905 Please comment the company named kelogg, whose information is given, as in the attached examples.write a report .containing your comments.do not be too breif. 1999 2000 2001 2002 Blake International 2003 3.11 2.83 Current ratio 2.54 2.22 1.99 1.64 1.78 Acid-test ratio 1.56 1.35 1.33 53.16 62.00 56.29 58.63 52.48 Average collection period Accounts receivable tumover Inventory turnover 6.87 5.89 6.48 6.23 6.95 3.28 3.87 4.00 3.73 4.21 0.22 0.15 0.16 0.08 0.09 0.40 0.39 0.38 0.38 0.40 Operating income retum on investment Gross profit margin Operating profit margin Total asset turnover Fixed asset hamover 0.10 0.08 0.08 0.04 0.05 2.10 1.95 2.07 1.85 1.85 18.13 18.81 23.21 18.64 16.29 Debt ratio 0.43 0.79 0.71 0.69 0.66 Times interest eamed 14.00 6.31 4.31 2.30 2.78 0.02 Return on equity 0.18 0.36 0.27 0.04 Note: Above ratio calculations may be subject to rounding errors. Question 1 It is apparent that Blake's liquidity is decreasing over time, as the current and acid-test ratios indicate. However, the receivable turnover and average collection period stayed relatively constant while the inventory turnover actually increased. When we review the balance sheet, we note that the cash balance has actually increased while the receivable and inventory balances decreased, creating more liquidity within the total current assets, even though the net current asset balance decreased in total. The real problem lies with the increase in current liabilities over time in combination with the decrease in current Question #2 Also of great concern is the decrease in operating profitability that is shown in the OIROI ratios over time. The problem does not seem to be in the cost of goods sold as indicated by the gross profit margin ratio. The problem appears in the operating profit margin having also decreased over time. Upon review of the income statement, we will see that while sales have decreased the operating expenses have stayed the same. The total asset turnover and fixed asset turnover have also decreased, although not to the same degree Blake has lowered the asset balances as sales have lowered, but still needs to work further to lower fixed assets, decrease expenses, and increase sales. Question #3 While sales and assets have decreased over time, the level of debt to equity has increased. As of 2003, 66% of Blake's assets are being financed through the use of debt. The company is quickly becoming over-leveraged and soon will lose its ability to pay interest as the times interest camed ratio shows Question 14 Return on common equity has declined, especially in the last two years. This can be the result of two factors, a lower rate of return or financing through less debt. As noted above, Blake has increased debt greatly over the last five years. As we have also noted, Blake's operating profitability has also decreased over the last few years as a result of decreasing sales and higher interest costs. We can safely assume that the decreasing return is the result of decreasing profits. Q 1999 Scott Corp Current ratio 2000 2001 2002 2003 1.85 1.86 2.05 2.07 2.26 Acid-test ratio 1.28 1.22 1.33 1.25 1.43 80.75 75.92 69.69 63.96 64.71 Average collection period Accounts receivable turnover Inventory turnover 4.52 4.81 5.24 5.71 5.64 4.45 4.01 4.42 Operating income retum og investment 0.21 0.24 0.25 0.16 0.16 0.41 0.41 0.42 0.38 0.40 Gross profit margin Operating profit margin Total asset tumover 0.14 0.14 0.15 0.019 0.10 1.51 1.64 1.71 1.77 Fixed asset turnover 1.67 R.58 10.06 9.96 8.28 Debt ratio 6.93 0.37 0.3% 0.41 0.40 0.36 Question 3 Upon initial review of the debt ratio, Scott seems to be successively financing its growth with the same proportion of debt over the last five years. However, Scott does need to be aware that the times interest eamed is trending down due to the fact that the operating expenses have grown disproportionately. This will impact its ability to service debt over future years. Question #4 Scott has decreased its retum on common equity especially in the last two years. Since Scott hus not decreased its debt ratio, we must review the income statement for the explanation. Even though Scott has almost doubled its sales, net income has remained the same. This is the result of decreased operating profit margin and increased interest. The increased interest is either the result of increased debt or a higher cost of debt. 2 The differences in Scott's and Blake's financial performance are easy to find. Scott continues to be a thriving company while Blake seems to have many financial problems. Scott's sales have grown 84% while Blake's sales have decreased by 17%. However, they also have many similarities. Let's look at the differences and similarities by question Liquidity - Both Blake and Scott have done a good job of controlling their inventories and receivables. Both had positive trends in these areas. The difference is that Scott has considerable liquidity while Blake is losing this ability due to its increasing current liabilities. Profitability - Both Scott and Blake are having problems with operating profitability. Their OIROI's have trended downward over time due to increasing operating expenses a and increasing fixed assets as compared to sales Financing - The tree differences appear in how Blake and Scott are financing their assets. While Scott's debt ratio has stayed the same, Blake has increased its debt ratio to 66%. This has significantly increased the risk to the financial health of Blake. While both Scott's and Blake's times interest earned have decreased due to increasing operating expenses. Blake is dangerously close to losing its ability to service its debt. Return on Investment - Once again, Scott and Blake are more similar than different, except as to the severity of the amount. Scott and Blake have decreased their retum on investment. Blake has increased its debt while Scott's stayed the same. Both have decreased their net income as compared to sales. This is the result of increased operating and interest costs, as gross profit margins have stayed the same. ratio analiz kellogs.xlsx Current ratio Acid test ratio Cash Ratio Total asset turnover Fixed asset turnover Inventory turnover Days in Inventory A/R turnover Average collection period A/P Turnover Average Payment Day Operating Cycle Cash Conversion Cycle Debt ratio Long Term Debt Ratio Times interest earned 2019 2018 2017 2016 2015 0,71808288 0,69706337 0,67138434 0,65713008 0.5638613 0,461490163 0,40340031 0,40225564 0,38042021 0,34605332 0,083089159 0,07087657 0,06214065 0,06258382 0,04373584 0,773058529 0,76192351 0,78612929 0,86122692 0,88682709 0,960730206 0.92641729 0,96537739 1,069263 1,12567624 7,501631321 6,63233083 6,68118324 6,67124394 7,0752 48,66017864 55,0361882 54,63254 54,7144356 51,590106 8,615482234 9,85236364 9,25413967 10,5718928 10,063244 42,3655914 37,0469477 39,441808 34,525511 36,27061 3,809384164 3,68108776 3,47289555 4,09483615 4,62244363 0,000719204 0,00074427 0,00078889 0.00066907 0,0005927 91,02577004 92,0831358 94,074348 89,2399466 87,860716 91,02505084 92,0823916 94,0735591 89,2392775 87,8601233 0.811318606 0,793982 0,8658186 0,87254318 0,85981247 0,409644728 0,46158605 0,47923674 0,44325326 0,34587896 4,595070423 4,63066202 6,47265625 2,28325123 3,40528634 Gross Profit Margin Operating profit margin Net profit margin Return on total assets Return on equity 0,322654294 0,34885953 0,36556714 0,36537575 0,34609982 0,103181617 0,12593194 0,10788737 0,10719225 0,08066543 0,071954632 0,09921016 0,09755718 0,05340403 0,04539741 0,074299704 0,07474691 0,10133937 0,06134604 0,0506852 9,304761905 12,8 11,9428571 6,61904762 5,84761905 Return on equity 9,304761905 Please comment the company named kelogg, whose information is given, as in the attached examples.write a report .containing your comments.do not be too breif. 1999 2000 2001 2002 Blake International 2003 3.11 2.83 Current ratio 2.54 2.22 1.99 1.64 1.78 Acid-test ratio 1.56 1.35 1.33 53.16 62.00 56.29 58.63 52.48 Average collection period Accounts receivable tumover Inventory turnover 6.87 5.89 6.48 6.23 6.95 3.28 3.87 4.00 3.73 4.21 0.22 0.15 0.16 0.08 0.09 0.40 0.39 0.38 0.38 0.40 Operating income retum on investment Gross profit margin Operating profit margin Total asset turnover Fixed asset hamover 0.10 0.08 0.08 0.04 0.05 2.10 1.95 2.07 1.85 1.85 18.13 18.81 23.21 18.64 16.29 Debt ratio 0.43 0.79 0.71 0.69 0.66 Times interest eamed 14.00 6.31 4.31 2.30 2.78 0.02 Return on equity 0.18 0.36 0.27 0.04 Note: Above ratio calculations may be subject to rounding errors. Question 1 It is apparent that Blake's liquidity is decreasing over time, as the current and acid-test ratios indicate. However, the receivable turnover and average collection period stayed relatively constant while the inventory turnover actually increased. When we review the balance sheet, we note that the cash balance has actually increased while the receivable and inventory balances decreased, creating more liquidity within the total current assets, even though the net current asset balance decreased in total. The real problem lies with the increase in current liabilities over time in combination with the decrease in current Question #2 Also of great concern is the decrease in operating profitability that is shown in the OIROI ratios over time. The problem does not seem to be in the cost of goods sold as indicated by the gross profit margin ratio. The problem appears in the operating profit margin having also decreased over time. Upon review of the income statement, we will see that while sales have decreased the operating expenses have stayed the same. The total asset turnover and fixed asset turnover have also decreased, although not to the same degree Blake has lowered the asset balances as sales have lowered, but still needs to work further to lower fixed assets, decrease expenses, and increase sales. Question #3 While sales and assets have decreased over time, the level of debt to equity has increased. As of 2003, 66% of Blake's assets are being financed through the use of debt. The company is quickly becoming over-leveraged and soon will lose its ability to pay interest as the times interest camed ratio shows Question 14 Return on common equity has declined, especially in the last two years. This can be the result of two factors, a lower rate of return or financing through less debt. As noted above, Blake has increased debt greatly over the last five years. As we have also noted, Blake's operating profitability has also decreased over the last few years as a result of decreasing sales and higher interest costs. We can safely assume that the decreasing return is the result of decreasing profits. Q 1999 Scott Corp Current ratio 2000 2001 2002 2003 1.85 1.86 2.05 2.07 2.26 Acid-test ratio 1.28 1.22 1.33 1.25 1.43 80.75 75.92 69.69 63.96 64.71 Average collection period Accounts receivable turnover Inventory turnover 4.52 4.81 5.24 5.71 5.64 4.45 4.01 4.42 Operating income retum og investment 0.21 0.24 0.25 0.16 0.16 0.41 0.41 0.42 0.38 0.40 Gross profit margin Operating profit margin Total asset tumover 0.14 0.14 0.15 0.019 0.10 1.51 1.64 1.71 1.77 Fixed asset turnover 1.67 R.58 10.06 9.96 8.28 Debt ratio 6.93 0.37 0.3% 0.41 0.40 0.36 Question 3 Upon initial review of the debt ratio, Scott seems to be successively financing its growth with the same proportion of debt over the last five years. However, Scott does need to be aware that the times interest eamed is trending down due to the fact that the operating expenses have grown disproportionately. This will impact its ability to service debt over future years. Question #4 Scott has decreased its retum on common equity especially in the last two years. Since Scott hus not decreased its debt ratio, we must review the income statement for the explanation. Even though Scott has almost doubled its sales, net income has remained the same. This is the result of decreased operating profit margin and increased interest. The increased interest is either the result of increased debt or a higher cost of debt. 2 The differences in Scott's and Blake's financial performance are easy to find. Scott continues to be a thriving company while Blake seems to have many financial problems. Scott's sales have grown 84% while Blake's sales have decreased by 17%. However, they also have many similarities. Let's look at the differences and similarities by question Liquidity - Both Blake and Scott have done a good job of controlling their inventories and receivables. Both had positive trends in these areas. The difference is that Scott has considerable liquidity while Blake is losing this ability due to its increasing current liabilities. Profitability - Both Scott and Blake are having problems with operating profitability. Their OIROI's have trended downward over time due to increasing operating expenses a and increasing fixed assets as compared to sales Financing - The tree differences appear in how Blake and Scott are financing their assets. While Scott's debt ratio has stayed the same, Blake has increased its debt ratio to 66%. This has significantly increased the risk to the financial health of Blake. While both Scott's and Blake's times interest earned have decreased due to increasing operating expenses. Blake is dangerously close to losing its ability to service its debt. Return on Investment - Once again, Scott and Blake are more similar than different, except as to the severity of the amount. Scott and Blake have decreased their retum on investment. Blake has increased its debt while Scott's stayed the same. Both have decreased their net income as compared to sales. This is the result of increased operating and interest costs, as gross profit margins have stayed the same
Step by Step Solution
There are 3 Steps involved in it
Step: 1

Get Instant Access with AI-Powered Solutions
See step-by-step solutions with expert insights and AI powered tools for academic success
Step: 2

Step: 3
Ace Your Homework with AI
Get the answers you need in no time with our AI-driven, step-by-step assistance
Get Started
Accounting Tools for Business Decision Making
Authors: Paul D. Kimmel, Jerry J. Weygandt, Donald E. Kieso
5th edition
9780470418239, 470239808, 9780470239803, 470418230, 978-1118128169