Answered step by step
Verified Expert Solution
Question
1 Approved Answer
Ratios and Financial Planning at East Coast Yachts Input area: begin{tabular}{lccc} & multicolumn{2}{c}{ Yacht Industry Ratios } & Current ratio & Lower Quartile &
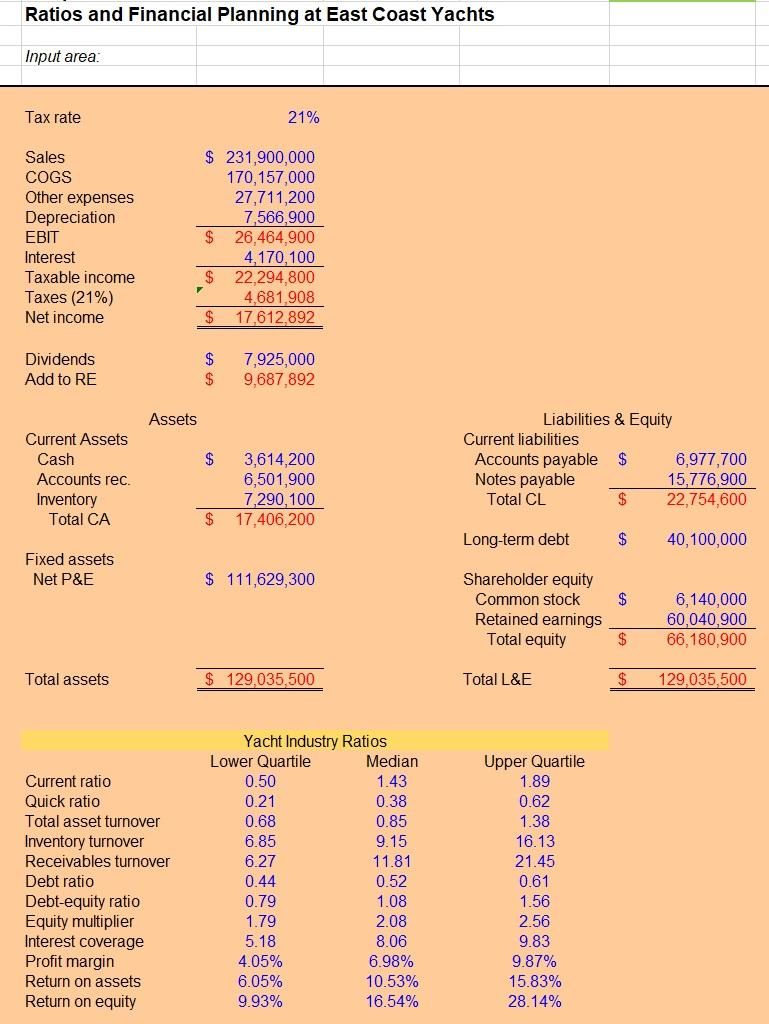
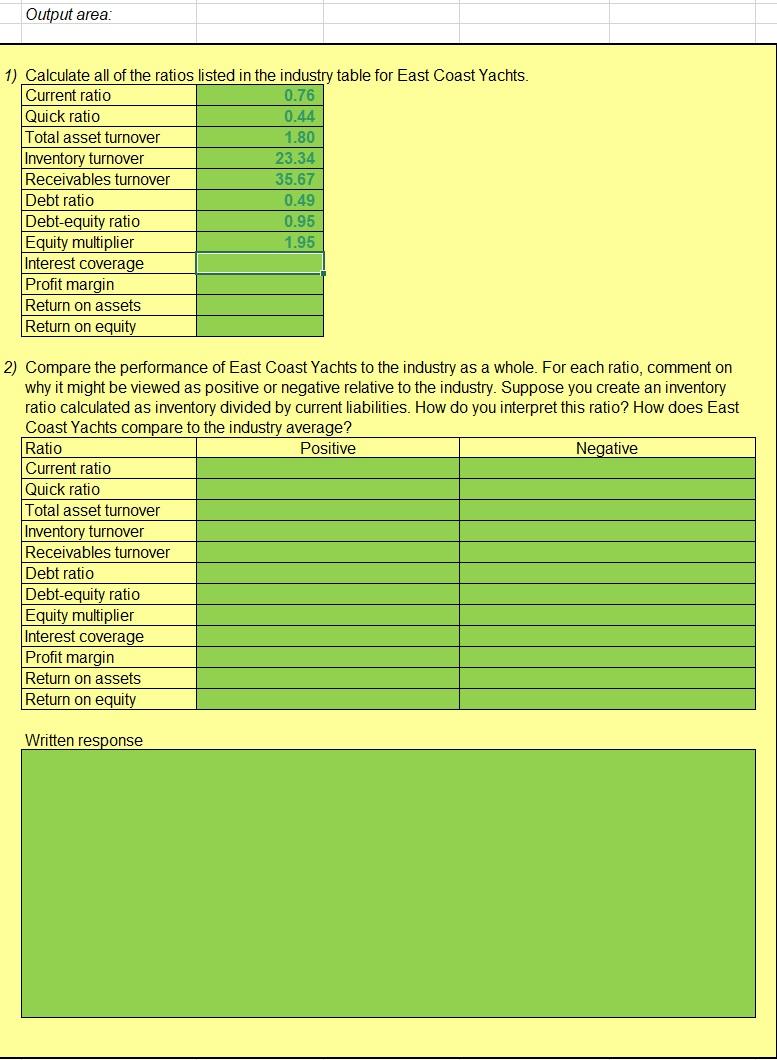
Ratios and Financial Planning at East Coast Yachts Input area: \begin{tabular}{lccc} & \multicolumn{2}{c}{ Yacht Industry Ratios } & \\ Current ratio & Lower Quartile & Median & Upper Quartile \\ Quick ratio & 0.50 & 1.43 & 1.89 \\ Total asset turnover & 0.21 & 0.38 & 0.62 \\ Inventory turnover & 0.68 & 0.85 & 1.38 \\ Receivables turnover & 6.85 & 9.15 & 16.13 \\ Debt ratio & 6.27 & 11.81 & 21.45 \\ Debt-equity ratio & 0.44 & 0.52 & 0.61 \\ Equity multiplier & 0.79 & 1.08 & 1.56 \\ Interest coverage & 1.79 & 2.08 & 2.56 \\ Profit margin & 5.18 & 8.06 & 9.83 \\ Return on assets & 4.05% & 6.98% & 9.87% \\ Return on equity & 6.05% & 10.53% & 15.83% \\ & 9.93% & 16.54% & 28.14% \end{tabular} 1) Calculate all of the ratios listed in the industry table for East Coast Yachts. 2) Compare the performance of East Coast Yachts to the industry as a whole. For each ratio, comment on why it might be viewed as positive or negative relative to the industry. Suppose you create an inventory ratio calculated as inventory divided by current liabilities. How do you interpret this ratio? How does East Coast Yachts compare to the industry average? Written resnonse
Step by Step Solution
There are 3 Steps involved in it
Step: 1
Get Instant Access to Expert-Tailored Solutions
See step-by-step solutions with expert insights and AI powered tools for academic success
Step: 2
Step: 3
Ace Your Homework with AI
Get the answers you need in no time with our AI-driven, step-by-step assistance
Get Started